Earlier this month the U.S. District Court for the Eastern District of Virginia found Virginia’s 3rd Congressional District to be a racial gerrymander, therefore deeming the state’s congressional map unconstitutional. The attorney for the Virginia Republican congressional delegation said an appeal of this latest ruling to the Supreme Court is likely, as did Rep. Bob Goodlatte (R, VA-6). But if the Supreme Court declines to take the case, the Virginia General Assembly will have to redraw the state’s district lines by Sept. 1.
There are a number of potential outcomes, but this ruling increases the likelihood that Virginia will end up with a fresh set of congressional boundaries. As for what a replacement map might look like, Stephen Wolf takes a thorough look at some potential outcomes.
The possibility of future linear machinations prompted the Crystal Ball to take a look back at the last five decades of congressional district cartography in Virginia. We thought it would be useful to readers to see what the lines looked like in the past and how many redistricting conflicts presaged the current one.
1. Post-1960 census district map: First election in 1962 for 88th Congress

Note: Click on map to enlarge and see independent city key
Source: Bureau of the Census, Congressional District Data Book, Districts of the 88th Congress (A Statistical Abstract Supplement). U.S. Government Printing Office, Washington, DC, 1963. Accessed via HathiTrust.
The post-1960 census map was actually a simple continuation of the map Virginia put into place after the 1950 census, when reapportionment assigned a 10th House seat to the Old Dominion. At this time, Democrats controlled eight of the state’s districts, with Republicans holding only the 6th and 10th Districts. As this map was drawn prior to “one man, one vote,” district populations ranged from 539,618 in the 10th, which abutted Washington, DC, to just 312,890 in the 7th, which mainly included the Shenandoah Valley.
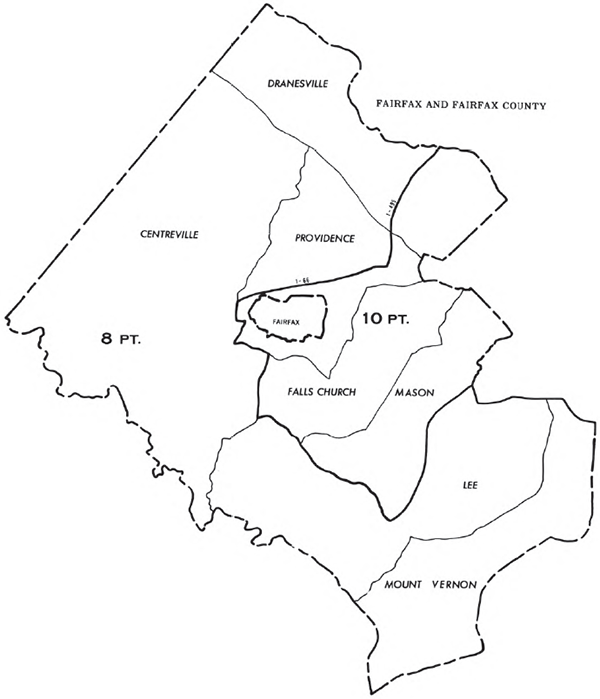
2. 1965 map (and inset): First election in 1966 for 90th Congress

Note: Click on state map to enlarge and see independent city key
Map inset: Northern Virginia
Source: Bureau of the Census, Supplement to Congressional District Data Book: Redistricted States. U.S. Government Printing Office, Washington, DC: 1967. Accessed via HathiTrust.
In January 1965, the Virginia Supreme Court of Appeals found that the congressional map violated both the state and federal constitutions and ordered the state to redraw its boundaries to reduce the significant district-to-district population differences. The court ruling reflected the many recent judicial decisions that had impacted representation, including rulings backing “one man, one vote.” The new district plan was passed in the General Assembly on Sept. 3, 1965, and while it didn’t completely undo some population variation between the districts (eight of 10 were within ±5% deviation), it did reduce overpopulation in the more urban 2nd and 10th Districts.
The new map featured the first partition of a county in the state’s history, adding much of the western part of Fairfax County to the 8th District while the more developed eastern part remained in the 10th. This change would play a role in altering the dynamics of the 8th, represented by 18-term Rep. Howard W. Smith (D), then-chair of the powerful House Rules Committee. Smith went on to shockingly lose to liberal state Del. George C. Rawlings in the Democratic primary in 1966. Rawlings’ primary victory wound up helping to launch the career of William Scott (R), a Fairfax attorney who beat Rawlings in November; Scott would later defeat Sen. William Spong (D) in the state’s 1972 U.S. Senate contest, assisted by President Nixon’s long reelection coattails. Following the GOP successes nationally in 1966, the state’s delegation was 6-4 in favor of Democrats at the start of the 90th Congress.
3. 1971 map: Never used

Note: Click on state map to enlarge and see independent city key
Source: Bureau of the Census, Congressional District Data; Districts of the 93d Congress. U.S. Government Printing Office, Washington, DC, 1972. Accessed via HathiTrust.
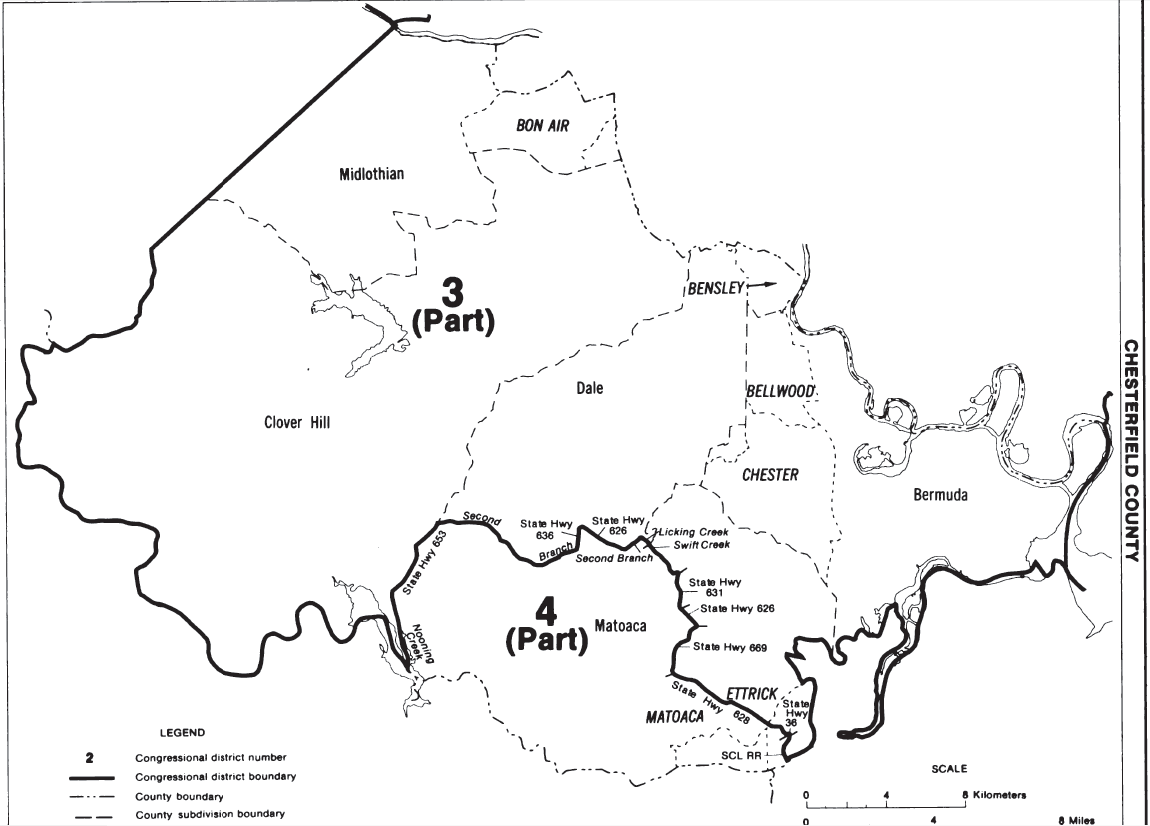
4. 1972 map: First election in 1972 for 93rd Congress

Note: Click on state map to enlarge and see independent city key
Source: Bureau of the Census, Congressional District Data Book, 93d Congress (A Statistical Abstract Supplement). U.S. Government Printing Office, Washington, DC, 1973. Accessed via HathiTrust.
The next redistricting cycle would prove to be more challenging. Recent U.S. Supreme Court decisions necessitated much smaller deviations in population from district to district. The 1970 census found that population growth in districts in western Virginia and in Southside had not kept pace with the growth seen in most of the more urban and suburban districts (still the case today). Besides the population shifts, incumbency and divided government (a first in the state’s modern history, with Republican Gov. Linwood Holton controlling the state’s executive branch) also created conflicts.
Passed in 1971, the first map attempted to deal with all these issues while retaining some population disparities that went slightly beyond recently-established precedents before the Supreme Court. This was a result of the Democratic-controlled General Assembly’s interest in preserving separate districts for Reps. Watkins Abbitt (D) and Dan Daniel (D); Abbitt, representing the 4th District, had his home in Appomattox County, not far from Daniel’s hometown of Danville in the 5th District. The map was summarily challenged in court and eventually ruled unconstitutional.
The drawing of the second map, adopted on March 11, 1972, was made easier by Abbitt’s decision to retire after over 20 years in the House. The plan had much less deviation than the previous effort: The new 5th District’s -0.44% deviation was the largest. The new map also expanded the number of localities that were divided beyond just Fairfax County, partitioning Chesterfield and Stafford counties and the city of Virginia Beach. The new plan helped turn over the state’s House delegation, which saw the exit of three incumbents. Following the 1972 election, Republicans held seven of the state’s 10 House seats.
5. 1981 map: First election in 1982 for 98th Congress

Note: Click on state map to enlarge and see independent city key
Map inset: Chesterfield County
Source: CQ Voting and Elections Collection, Congressional Districts Map, Virginia, 1981. CQ Press, Washington, DC, 2003. Map inset via the Bureau of the Census, Congressional Districts of the 98th Congress. U.S. Government Printing Office, Washington, DC, 1983. Accessed via HathiTrust.
At the federal level, Virginia’s post-1980 census map for the U.S. House didn’t encounter the same drama it had seen in the 1960s and 1970s, though the new map for the Virginia House of Delegates caused a maelstrom — but that’s another story. Divided government in Richmond (with Republican Gov. John Dalton) produced a congressional map that continued to push the lines of Virginia’s western districts further east as population growth centered around the Urban Crescent, particularly in Northern Virginia. Growth in the DC metro area necessitated splitting Prince William County for the first time between the 7th and 10th Districts, with the new independent cities of Manassas and Manassas Park and the northwestern half of Prince William shifting to the 7th District. In the 2nd District, shrinking Norfolk and booming Virginia Beach (population-wise) continued to be grouped together, except the new iteration of the map now included the entirety of both localities.
Politically, the GOP had a very successful cycle in the Reagan Revolution of 1980, just before this map was drawn, taking nine of the state’s 10 seats. But Gov. Dalton and Republicans in the General Assembly (in the minority) weren’t able to provide much assistance with the new lines as the pendulum swung back towards the Democrats in the Reagan midterm of 1982; Republicans lost three net seats, leaving them with a 6-4 advantage in the congressional delegation. Among those Democratic victors was state Sen. Rick Boucher, who defeated long-time Rep. William Wampler (R) by less than a percentage point in the “Fightin’ Ninth” in the westernmost part of the state. Boucher would go on to last 14 terms before he too wound up on the wrong side of a pendulum swing in the huge Republican wave year of 2010, losing to now-Rep. Morgan Griffith (R).
6. 1992 map: First election in 1992 for 103rd Congress

Note: Click on state map to enlarge and see independent city key
Source: Bureau of the Census, 1990 Census of Population and Housing. Population and Housing Characteristics for Congressional Districts of the 103rd Congress. Virginia. U.S. Government Printing Office, Washington, DC, 1993. Accessed via HathiTrust.
The new congressional map following the 1990 census had major short and long-term political ramifications for both parties. A number of factors impacted the mapmaking process. For the first time since the 1960s, Virginia redistricted with one-party control of the process (the Democrats) in Richmond. Second, reapportionment following the 1990 census gave the Old Dominion an 11th congressional district, its first increase since the 1950 census. Third, for the first time the new map would include a majority-minority district, reflecting a need to address the state’s lack of African-American representation despite the fact that 19% of Virginians were black.
Looking to create Democratic gains, Democrats drew Rep. George Allen (R), who had just won a 1991 special election to represent the old 7th District, into a new 7th District with veteran Rep. Thomas Bliley (R). Allen chose not to challenge Bliley for the GOP nomination, waiting instead for other political opportunities to arise. In the short term, the new plan was largely successful for Democrats in 1992: state Sen. Bobby Scott (D) won the new majority-minority 3rd easily, while state Del. Leslie Byrne (D) won the new 11th. Republicans did gain the 6th District, as Roanoke attorney Bob Goodlatte (R) won the race to replace retiring Rep. James Olin (D). But overall, Democrats went from holding a 6-4 advantage in the House delegation to holding a 7-4 edge after the 1992 elections.
However, in the long term, the 1992 map could not be called a success for Democrats. Byrne lost to Fairfax County Board of Supervisors Chair Tom Davis (R) in 1994, and more importantly, George Allen decided to run for governor in 1993. Few initially gave him much of a chance against Democratic state Attorney General Mary Sue Terry, but Allen wound up winning by a wide margin, becoming the first Republican to win the Virginia governorship since 1977. After his eventful governorship, Allen went on to defeat Sen. Chuck Robb (D) in the state’s 2000 Senate race. Six years later Allen was unseated by Jim Webb (D) in a contest that decided control of the U.S. Senate.
7. 1998 map: First election in 1998 for 106th Congress

Note: Click on state map to enlarge
Source: The Almanac of American Politics 2002
The 1992 map only survived three election cycles. Similar to the legal clash over Virginia’s map today, the majority-minority 3rd District was ruled unconstitutional by a federal court in 1997. Described by observers as a “grasping claw” or “squashed salamander,” the 3rd snaked across the map in order to have a voting-age population that was over 60% African American, prompting the court to rule it a racial gerrymander. In its ruling, the court found that the state had prioritized race over compactness, communities of interest, and locality boundaries to draw a safe black district. In the court’s judgment, the state’s defense of the map failed to meet the third condition of the three-prong test established by Thornburg v. Gingles (1986): that “the minority must be able to demonstrate that the white majority votes sufficiently as a bloc” to “usually defeat the minority’s preferred candidate.” Interestingly, however, the General Assembly’s black caucus had actually preferred a plan with a district that was over 60% black rather than two that were narrowly over 50% black.
Regardless, with the court’s decision, the state went back to the drawing board, producing a new map that Gov. Jim Gilmore (R) signed into law in February 1998. The boundaries of the 3rd District shifted markedly, reducing its black voting age population percentage from 61.6% to 50.5%. The changes to the 3rd led to alterations to the 1st, 2nd, and 4th districts as well. But overall, there was no representational impact, as the 1998 election cycle saw no districts change hands.
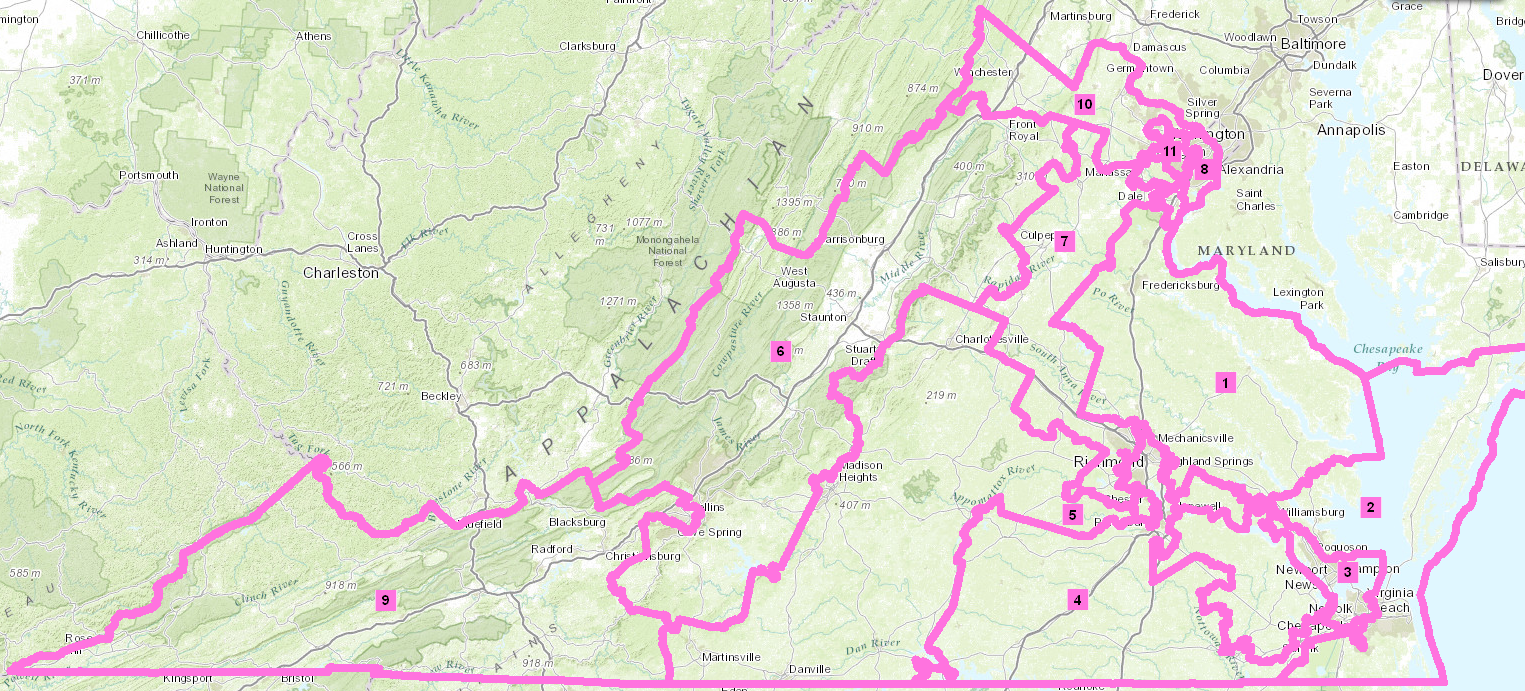
8. 2001 map: First election in 2002 for 108th Congress

Note: Click on state map to enlarge
Source: Census Bureau
Just three years later, politicians in Richmond had to once again put together a new congressional map following the 2000 census. But for the first time in Virginia history, Republicans held the governorship and both chambers of the General Assembly, giving them full control over the redistricting process. (More or less; there was a power-sharing agreement in the House of Delegates over committee structure, but the GOP held a majority of seats). The congressional plan, signed into law in July 2001, helped solidify what would become an 8-3 hold on the state’s 11 seats following independent Rep. Virgil Goode’s decision to run as a Republican in 2002.
Related to the current legal case regarding the 3rd District, the 2001 congressional plan drew criticism from some quarters for slightly increasing the percentage of African American voters in Scott’s district. A side effect of this change was to reduce the black voting age population in the 4th District from 38% to 32%. There, new Rep. Randy Forbes (R) had just narrowly won a special election in June 2001 to fill the seat following the death of Rep. Norman Sisisky (D). The alterations to the 3rd and 4th Districts made both seats safer for their respective incumbents. Naturally, there were legal challenges to these changes, but in 2004 a federal court ruled against the plaintiffs, who claimed the plan “packed” African Americans into the 3rd District to reduce black influence in the 4th District.
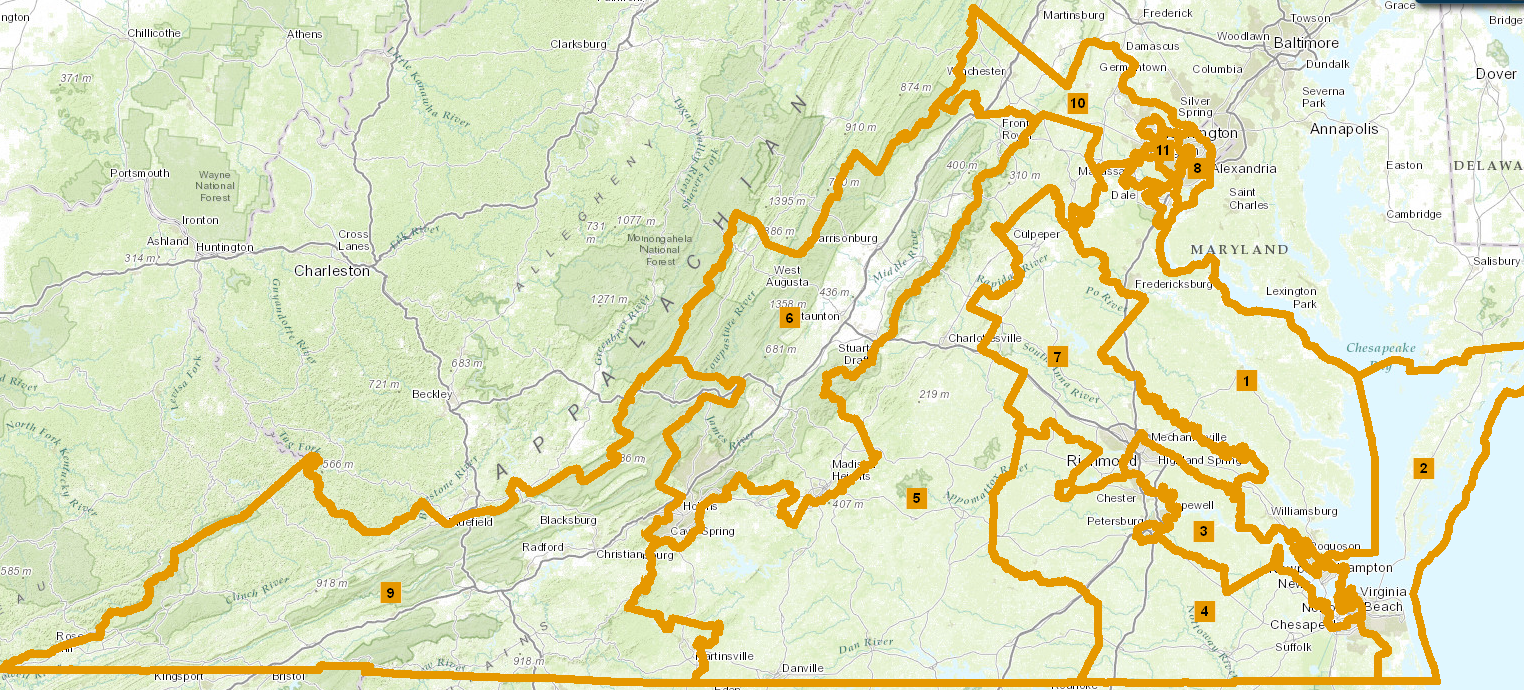
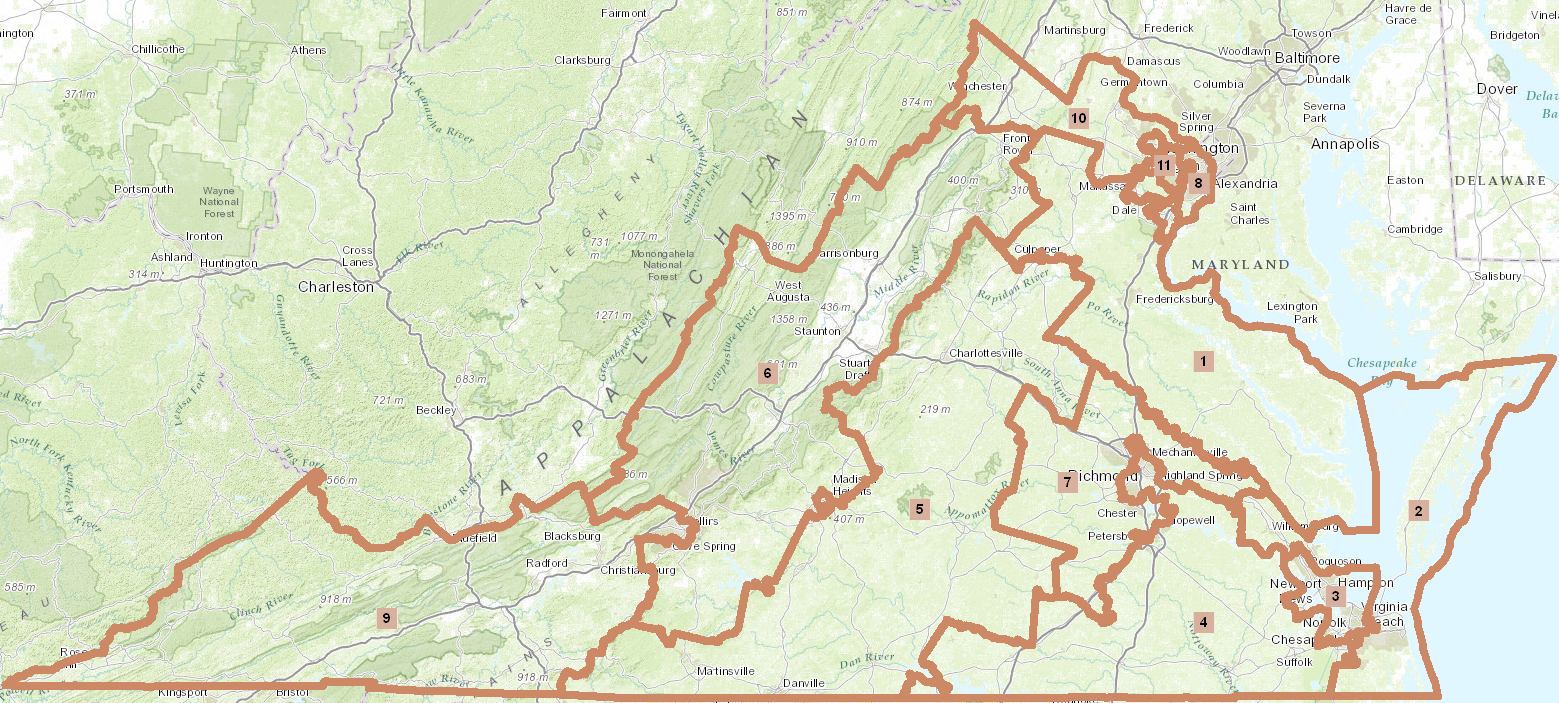
9. 2012 map: First election in 2012 for 113th Congress

Note: Click on state map to enlarge
Source: National Atlas of the United States
The most recent congressional redistricting in Virginia saw the implementation of what could surely be called an incumbent protection map. But it took a little while to get there, in part because of machinations regarding the state legislative maps.
With state legislative elections scheduled for November 2011, the General Assembly scheduled a special session to finalize new district boundaries. The Republican majority in the House of Delegates and the Democratic majority in the Senate of Virginia sought to protect their advantages in each chamber, drawing strongly partisan lines. But Gov. Bob McDonnell (R) vetoed the initial state-level maps to force Democrats in the Senate to draw a less egregious gerrymander. They complied, in part because of the potential threat of a court-drawn map that would have made it more difficult to hold onto their 22-18 majority. Meanwhile, the congressional redistricting process went unfinished. But the contours of the eventual map were revealed in March 2011: With the tacit approval of the Democratic congressmen, Republicans in the congressional delegation crafted a map that sought to protect incumbents of both parties.
Nevertheless, as long as the state Senate remained in Democratic hands, the future of this plan remained uncertain. Democrats in the General Assembly’s upper chamber had offered a competing plan (and a substitute version) that aimed to create a new majority-minority 4th District while adjusting the 3rd District in such a way as to make it a “minority-opportunity” district with a white plurality. But in the November 2011 elections, Republicans gained two net seats in the state Senate, enabling them to take control of the chamber via Lt. Gov. Bill Bolling’s (R) tie-breaking vote.
With full control of the General Assembly, the GOP now held full power over the redistricting process. During the 2012 legislative session, the new map, essentially the same as the one unveiled in March 2011, passed through the House of Delegates and the Senate of Virginia and was signed into law by Gov. McDonnell in late January 2012. The new lines helped cement the GOP’s 8-3 advantage in congressional representation (even as Virginia was becoming more Democratic).
The district that saw the most change was Rep. Gerry Connolly’s (D) 11th District, which went from being a district where Barack Obama won 57% in 2008 to one where he won 62% that year. Connolly had barely survived in 2010; he subsequently had relatively easy reelections in 2012 and 2014 under the new lines. But the GOP didn’t make his seat safer as a favor to Connolly: The new map shifted heavily Democratic-leaning parts of areas in Fairfax and Prince William counties into Connolly’s district while placing more Republican-leaning parts in then-Rep. Frank Wolf’s (R) 10th District as well as Rep. Rob Wittman’s (R) 1st District.
House Majority Leader Eric Cantor’s (R) 7th District also changed a bit, going from a district where John McCain won 53% in 2008 to one where McCain won 56%. Cantor’s district also lost some of its western-most counties. Although there were many reasons for Cantor’s 2014 primary loss to now-Rep. Dave Brat (R), the fact the district became more conservative may have played a role in his ouster.
Lastly, the majority-black 3rd District went from having a 53% African-American voting age population to having one that is 56% black, while the nearby 4th District shifted from having a voting age population that was 34% black to one that is 31% black. These changes play a key part in the ongoing legal battle.
Conclusion: A short timeline of recent events
This historical review brings us to the present day, where the future of the state’s congressional map is up in the air. It may be helpful to sketch out a short timeline of how we arrived at this point:
- In May 2014, plaintiffs brought a case before the U.S. District Court of the Eastern District of Virginia arguing that the 3rd District was drawn as a racial gerrymander.
- In October 2014, that court ruled in favor of the plaintiffs and instructed the General Assembly to redraw the congressional lines by April 1, 2015. The GOP congressional delegation appealed that decision; because the case was decided by a three-judge panel, the appeal went directly to the U.S. Supreme Court.
- In March 2015, the Supreme Court vacated a lower court’s ruling and ordered it to reconsider an Alabama case involving potential racial gerrymandering. With that decision, the Supreme Court also ordered the Virginia case to be reargued.
- At the beginning of this month, the U.S. District Court of the Eastern District of Virginia again found the congressional map to be unconstitutional and ordered the General Assembly to draw new lines by Sept. 1, 2015.
While it remains to be seen how this will all play out, the modern history of redistricting in Virginia illustrates just how thorny the process can be. Past conflicts still resonate today as the battle lines over the makeup of the ever-controversial 3rd District are remarkably similar to previous clashes over that district’s boundaries.
Proponents of nonpartisan redistricting would argue that much of this evidence points to the difficulties of having partisan institutions like the General Assembly and governor decide the district lines, whether at the state or federal level. But with the possible undoing of nonpartisan redistricting commissions in Arizona and California because of a case before the Supreme Court, a (somewhat) nonpartisan answer to Virginia’s redistricting struggles may not be an option in the future.
Going forward under the current redistricting system, we are likely to see similar future battles over familiar issues. Although history doesn’t repeat itself, it can certainly rhyme.