In 2008 Barack Obama carried Virginia’s 13 electoral votes, becoming the first Democratic presidential nominee since Lyndon Johnson in 1964 to win the Old Dominion. Obama’s victory broke a run of 10 consecutive Republican victories in the commonwealth, and 13 of 14 going back to 1952. The 2008 presidential election started a new Democratic streak, which has now seen the party carry Virginia three consecutive times, with Hillary Clinton winning it by 5.3 percentage points in 2016.
Obviously, this party flip shows a shift in Virginia’s partisan leaning. But if we dig deeper, the nature of this realignment becomes more complicated. Some parts of the state have drifted inexorably toward the Democrats while others have moved unceasingly in the GOP’s direction. These changes aren’t best shown simply by looking at which party carried which region, city, or county in a given election. Rather, the shifts are better illustrated by comparing voting in localities to the national conditions, i.e. the national popular vote.
Table 1: Virginia’s relative partisan lean compared to national popular vote margin, 1968 to 2016

Source: Dave Leip’s Atlas of U.S. Presidential Elections
To start, just consider Table 1, which displays the national popular vote margin and statewide vote margin in Virginia from 1968 to 2016, covering all presidential elections since the passage of the Voting Rights Act of 1965. The last two columns in the table note the state’s relative partisan lean compared to the national circumstances. For instance, Richard Nixon won the 1968 national popular vote by a little less than one percentage point, but he won Virginia by nearly 11 points. Thus, the state’s relative lean was about 10 points more Republican than the country as a whole. Even when Obama carried the commonwealth in 2008, it was still slightly more Republican than the nation. In both 2008 and 2012, Virginia’s margin was closest to the national popular vote margin, with the latter almost perfectly aligning. But in 2016, Virginia took a step to the left while the United States stepped slightly to the right (at least in the popular vote margin). While Clinton won nationally by about two points — while losing the Electoral College — she won Virginia by a bit more than five, making the state three points more Democratic than the country as a whole. The 2012 and 2016 elections marked the first time since 1948 that Virginia was more Democratic-leaning than Republican-leaning relative to the national popular vote margin.
Changing metropolitan areas
The transformation in Virginia’s statewide partisan lean is the product of some major changes in the voting habits in different parts of the commonwealth. If we take a step down from the statewide level, we can start to really see these shifts by looking at Virginia’s three major metropolitan areas and the parts of the state that lie outside of them.
The three metro areas of note in Virginia are located outside of Washington, DC, around the state capital of Richmond, and in the southeastern corner of the state. Together, these are sometimes called the “Urban Crescent” because of their geographical curvature from north to south. The subsequent analysis is based on the Office of Management and Budget’s (OMB) definitions of the localities that make up these three metropolitan statistical areas (MSAs) as of 2015. “Northern Virginia” consists of the Virginia-based localities within the Washington-Arlington-Alexandria, DC-VA-MD-WV MSA, “Greater Richmond” consists of the localities within the Richmond, VA MSA, and “Hampton Roads” consists of the Virginia-based localities within the Virginia Beach-Norfolk-Newport News, VA-NC MSA. Any locality not included among these three regions is categorized as being a part of the “Rest of Virginia.” It should be noted that Virginia has an unusual local government structure that has resulted in separate status for 38 independent cities from the state’s 95 counties. Whereas in Illinois the city of Chicago is a part of Cook County, in Virginia the city of Fairfax is actually a separate entity from Fairfax County, which surrounds it. Importantly for our purposes, the votes from all 133 cities and counties are recorded separately. Thus, the term “locality” is used throughout this article as a general term covering both cities and counties. While the definitions of MSAs have changed over time — e.g. Culpeper County would not have been considered part of the Washington, DC metro area in 1968 — it’s easier to compare consistent geographical areas across time, so the OMB’s 2015 MSA definitions are used for every election from 1968 to 2016.
Using the same method to calculate relative partisan lean as employed above to compare Virginia’s statewide vote to the nation as a whole, we can see in Chart 1 below how the Urban Crescent and the rest of the state have shifted over time relative to the national popular vote. Reflecting the state’s overall Republican lean, the metro areas tended to be more Republican than not for much of this period. But this wasn’t always the case. Hampton Roads was the lone part of the Urban Crescent to vote more Democratic than the country in three of four elections from 1968 to 1980, though the 1968 election is complicated by George Wallace’s third-party run. Perhaps reflecting Jimmy Carter’s stronger appeal in Appalachia and in Southern rural areas, the relative lean of the Rest of Virginia was only narrowly Republican in 1976 and 1980. Meanwhile, Greater Richmond and Northern Virginia were reliably more Republican than the nation as a whole from 1968 to 2000. To some extent, we can see how the metros and the rest of the state did not move far from one another throughout this period, at least in comparison to recent election cycles. For instance, all four areas were more GOP-leaning than the United States from 1984 to 2000.
Chart 1: The relative partisan lean of the Urban Crescent and rest of the state, 1968-2016

Sources: Author’s calculations based on Virginia Department of Elections data. Metropolitan areas based on the Office of Management and Budget’s 2015 definitions for the Richmond, VA MSA, the Virginia Beach-Norfolk-Newport News, VA-NC MSA, and the Washington-Arlington-Alexandria, DC-VA-MD-WV MSA.
However, 2004 broke that pattern, when Northern Virginia voted five points more Democratic by margin than the country did. That election foreshadowed future shifts, with Northern Virginia moving roughly eight points toward the Democrats compared to 2000 and Greater Richmond moving four points toward the Democrats.
The 2008 cycle featured large shifts in each part of the Urban Crescent. Northern Virginia leapt from a D +5 area in 2004 to about D +11, Greater Richmond went from R +8 to R +1, and Hampton Roads moved from R +4 to about D +5. Only the Rest of Virginia (R +17 to R +18) moved away from the Democrats in what was a very favorable election for them. To some extent, this trend has continued. Whereas Northern Virginia and the Rest of Virginia were at most 11 points apart in relative partisan lean from 1968 to 1996, in 2016 they were 49 points apart: Northern Virginia was around 24 points more Democratic than the country as a whole while the areas outside the Urban Crescent were about 26 points more Republican. While Hampton Roads shifted toward the GOP by one point from 2012 to 2016, it still remains notably more Democratic than not. And Greater Richmond, once the most rock-ribbed Republican part of the state in presidential politics, had almost the exact same lean (D +7) as Hampton Roads in 2016.
Population shifts and the share of the statewide vote made up by each metropolitan area are, of course, another critical feature of Virginia’s changing voting habits. Chart 2 lays out the data regarding the percentage share of the vote for the Urban Crescent and the Rest of Virginia. It demonstrates just how much Northern Virginia has grown in the past 50 years or so, moving from just 21% of the statewide vote (again, based on the 2015 metropolitan area definitions) to 35% in 2016. Meanwhile, Hampton Roads and Greater Richmond have remained relatively flat in their shares of the vote, perhaps reflecting consistent but not explosive population growth like that seen in the DC suburbs and exurbs. As Northern Virginia has gone up, Rest of Virginia has gone down, sliding from 42% in 1968 to 29% in 2016. If one were to create an alternate universe where the vote percentages from 2016 were applied to 1968 vote shares for the three metros and the rest of the state, Trump actually would have carried Virginia by one point, 48%-47%, in 2016.
Chart 2: Share of Virginia’s presidential vote in the Urban Crescent and rest of the state, 1968-2016

Sources: Author’s calculations based on Virginia Department of Elections data. Metropolitan areas based on the Office of Management and Budget’s 2015 definitions for the Richmond, VA MSA, the Virginia Beach-Norfolk-Newport News, VA-NC MSA, and the Washington-Arlington-Alexandria, DC-VA-MD-WV MSA.
The sharp Democratic turn in the Urban Crescent, combined with Norther Virginia’s sizable population growth, have been basic factors in Virginia’s move from fairly reliable Republican territory in presidential elections to its current battleground or even slightly leaning Democratic status in such contests.
Bluing crescent, reddening rural
Digging even deeper, data for the 13 presidential elections from 1968 to 2016 demonstrate the partisan shift and changing influence of Virginia’s localities. Note that this analysis uses today’s existing cities and counties. Old administrative divisions that existed in the period of interest, such as extinct counties or independent cities — Virginia has had a lot of each — are calculated based on where they exist today.
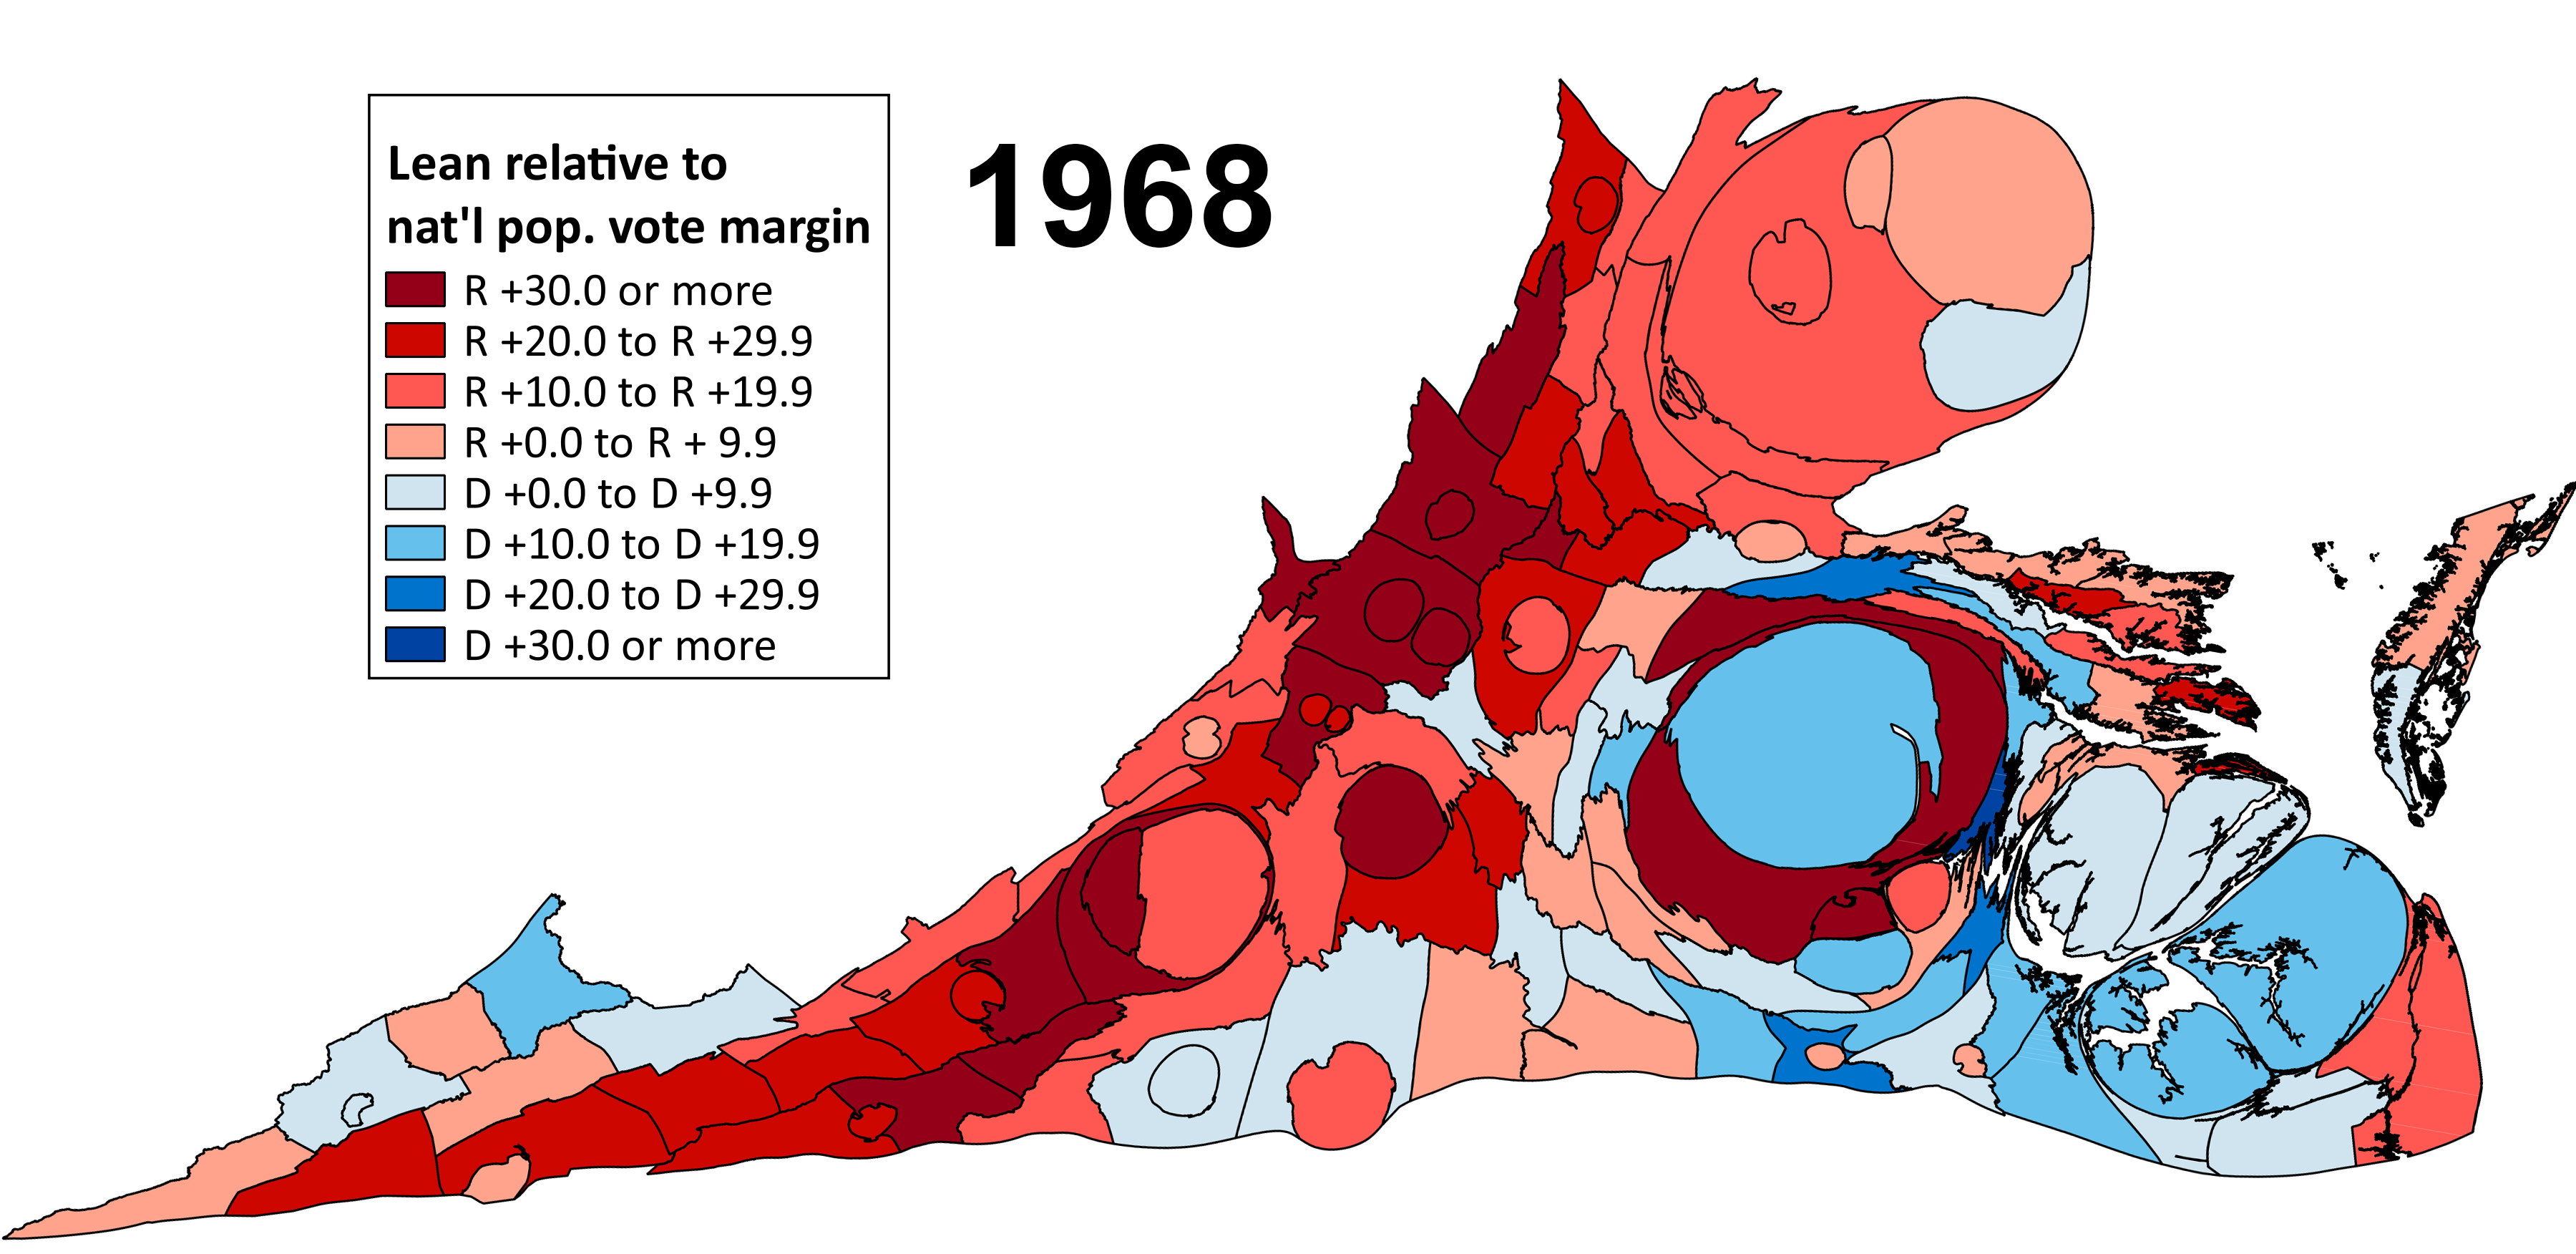
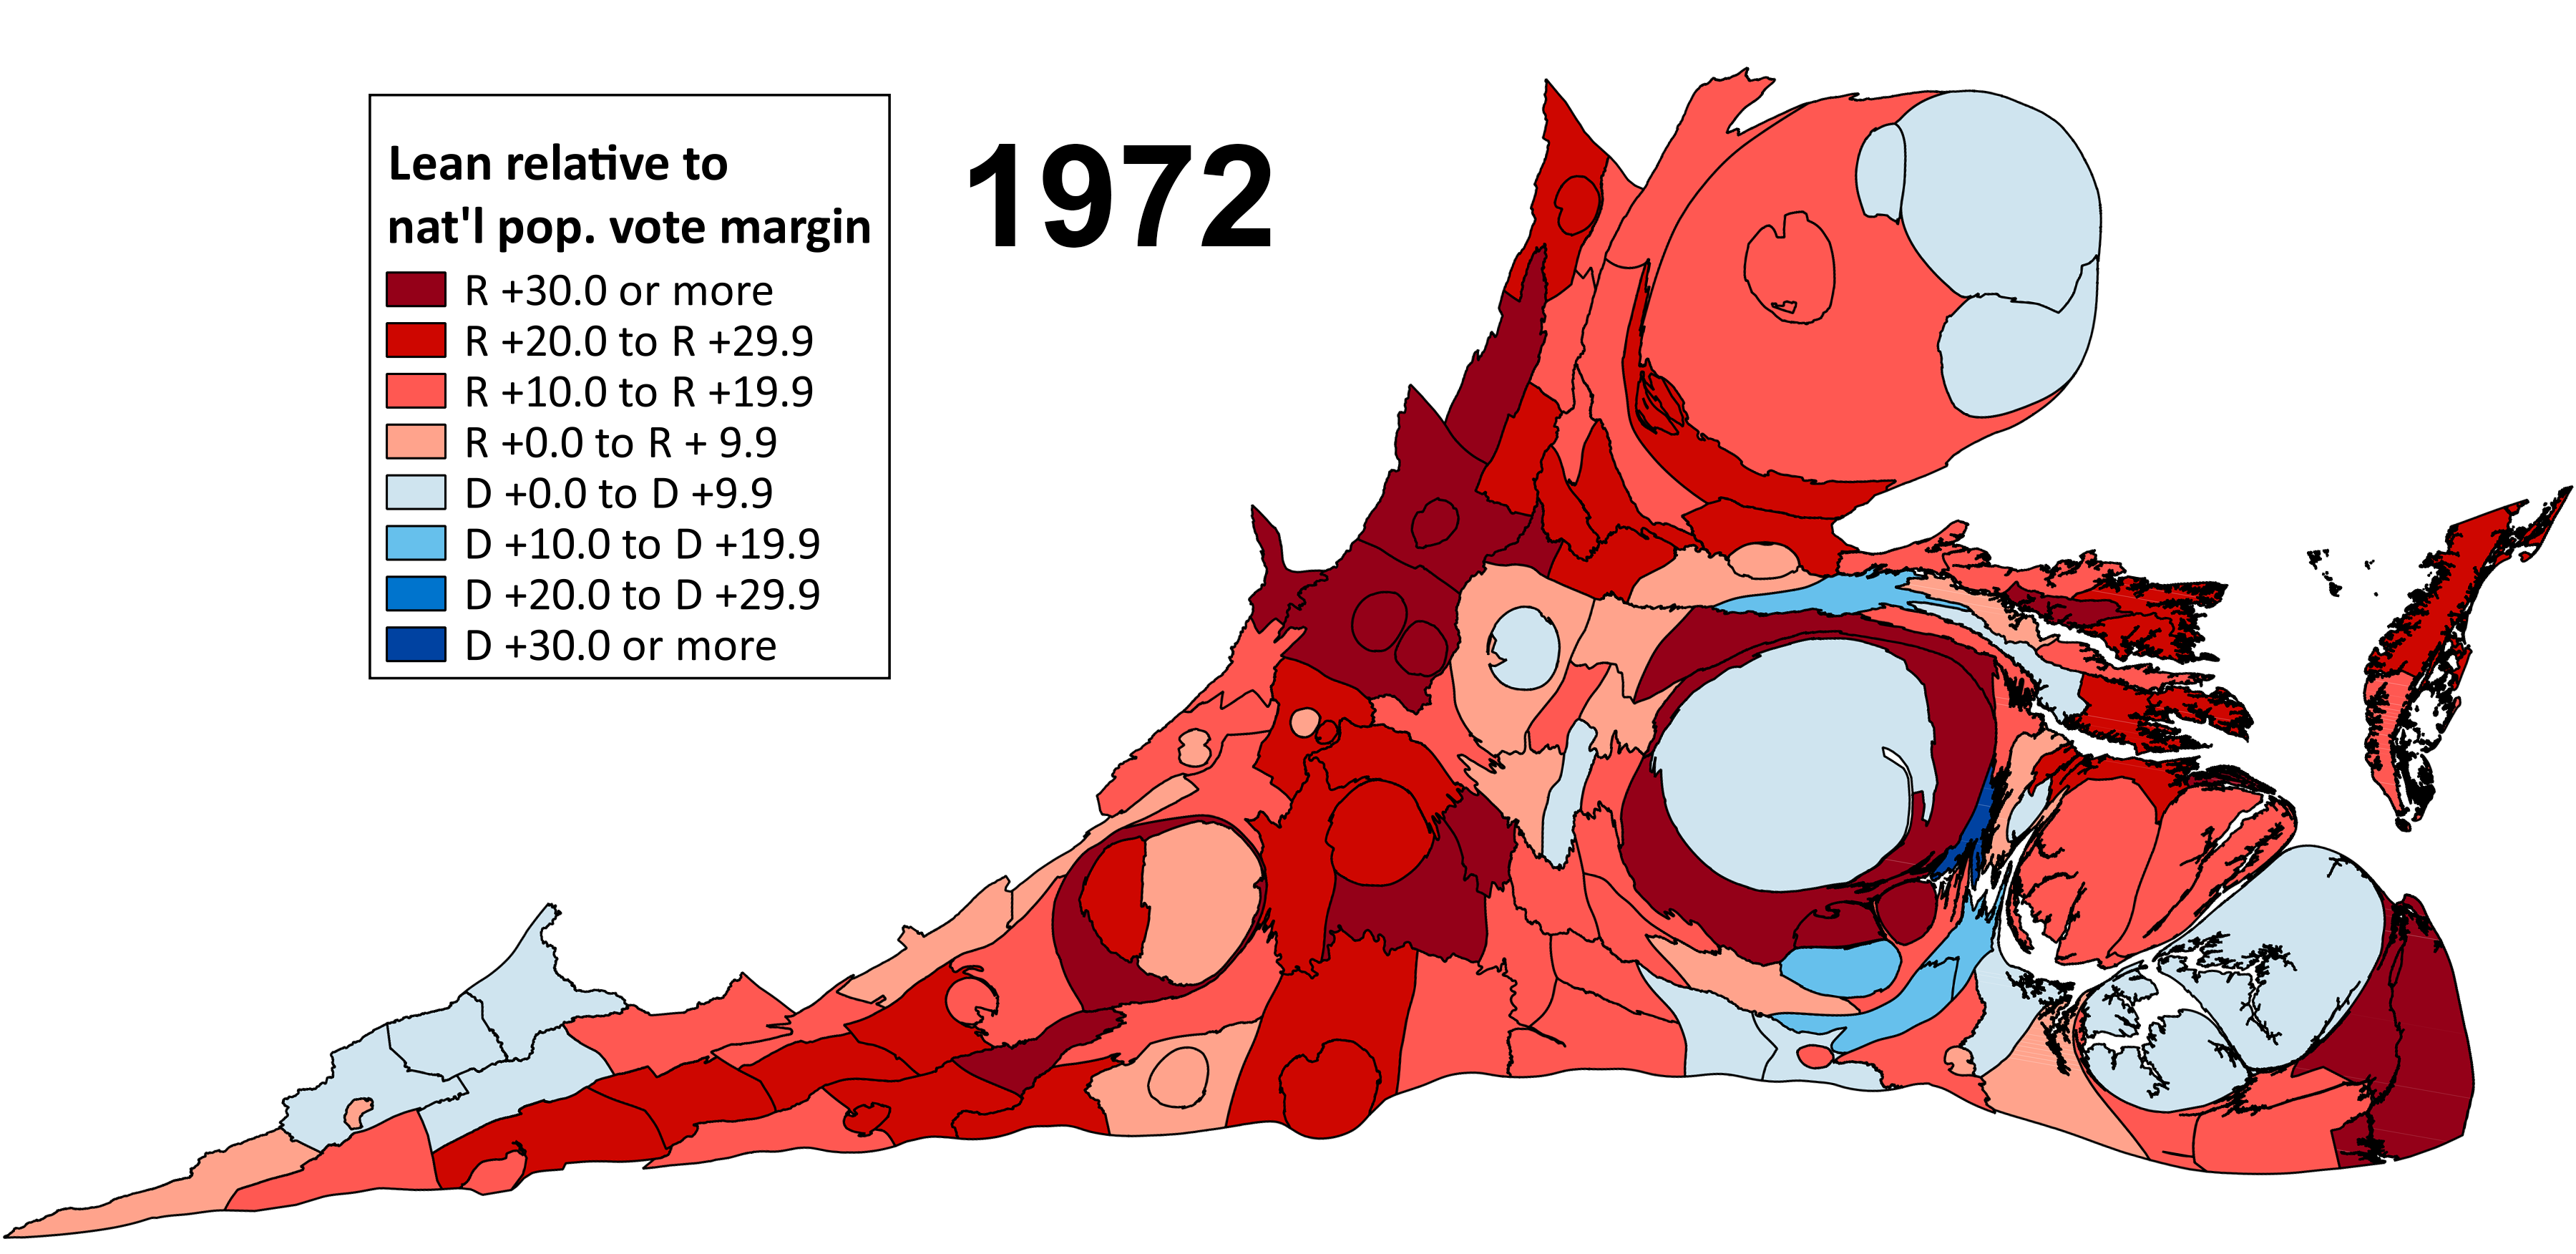
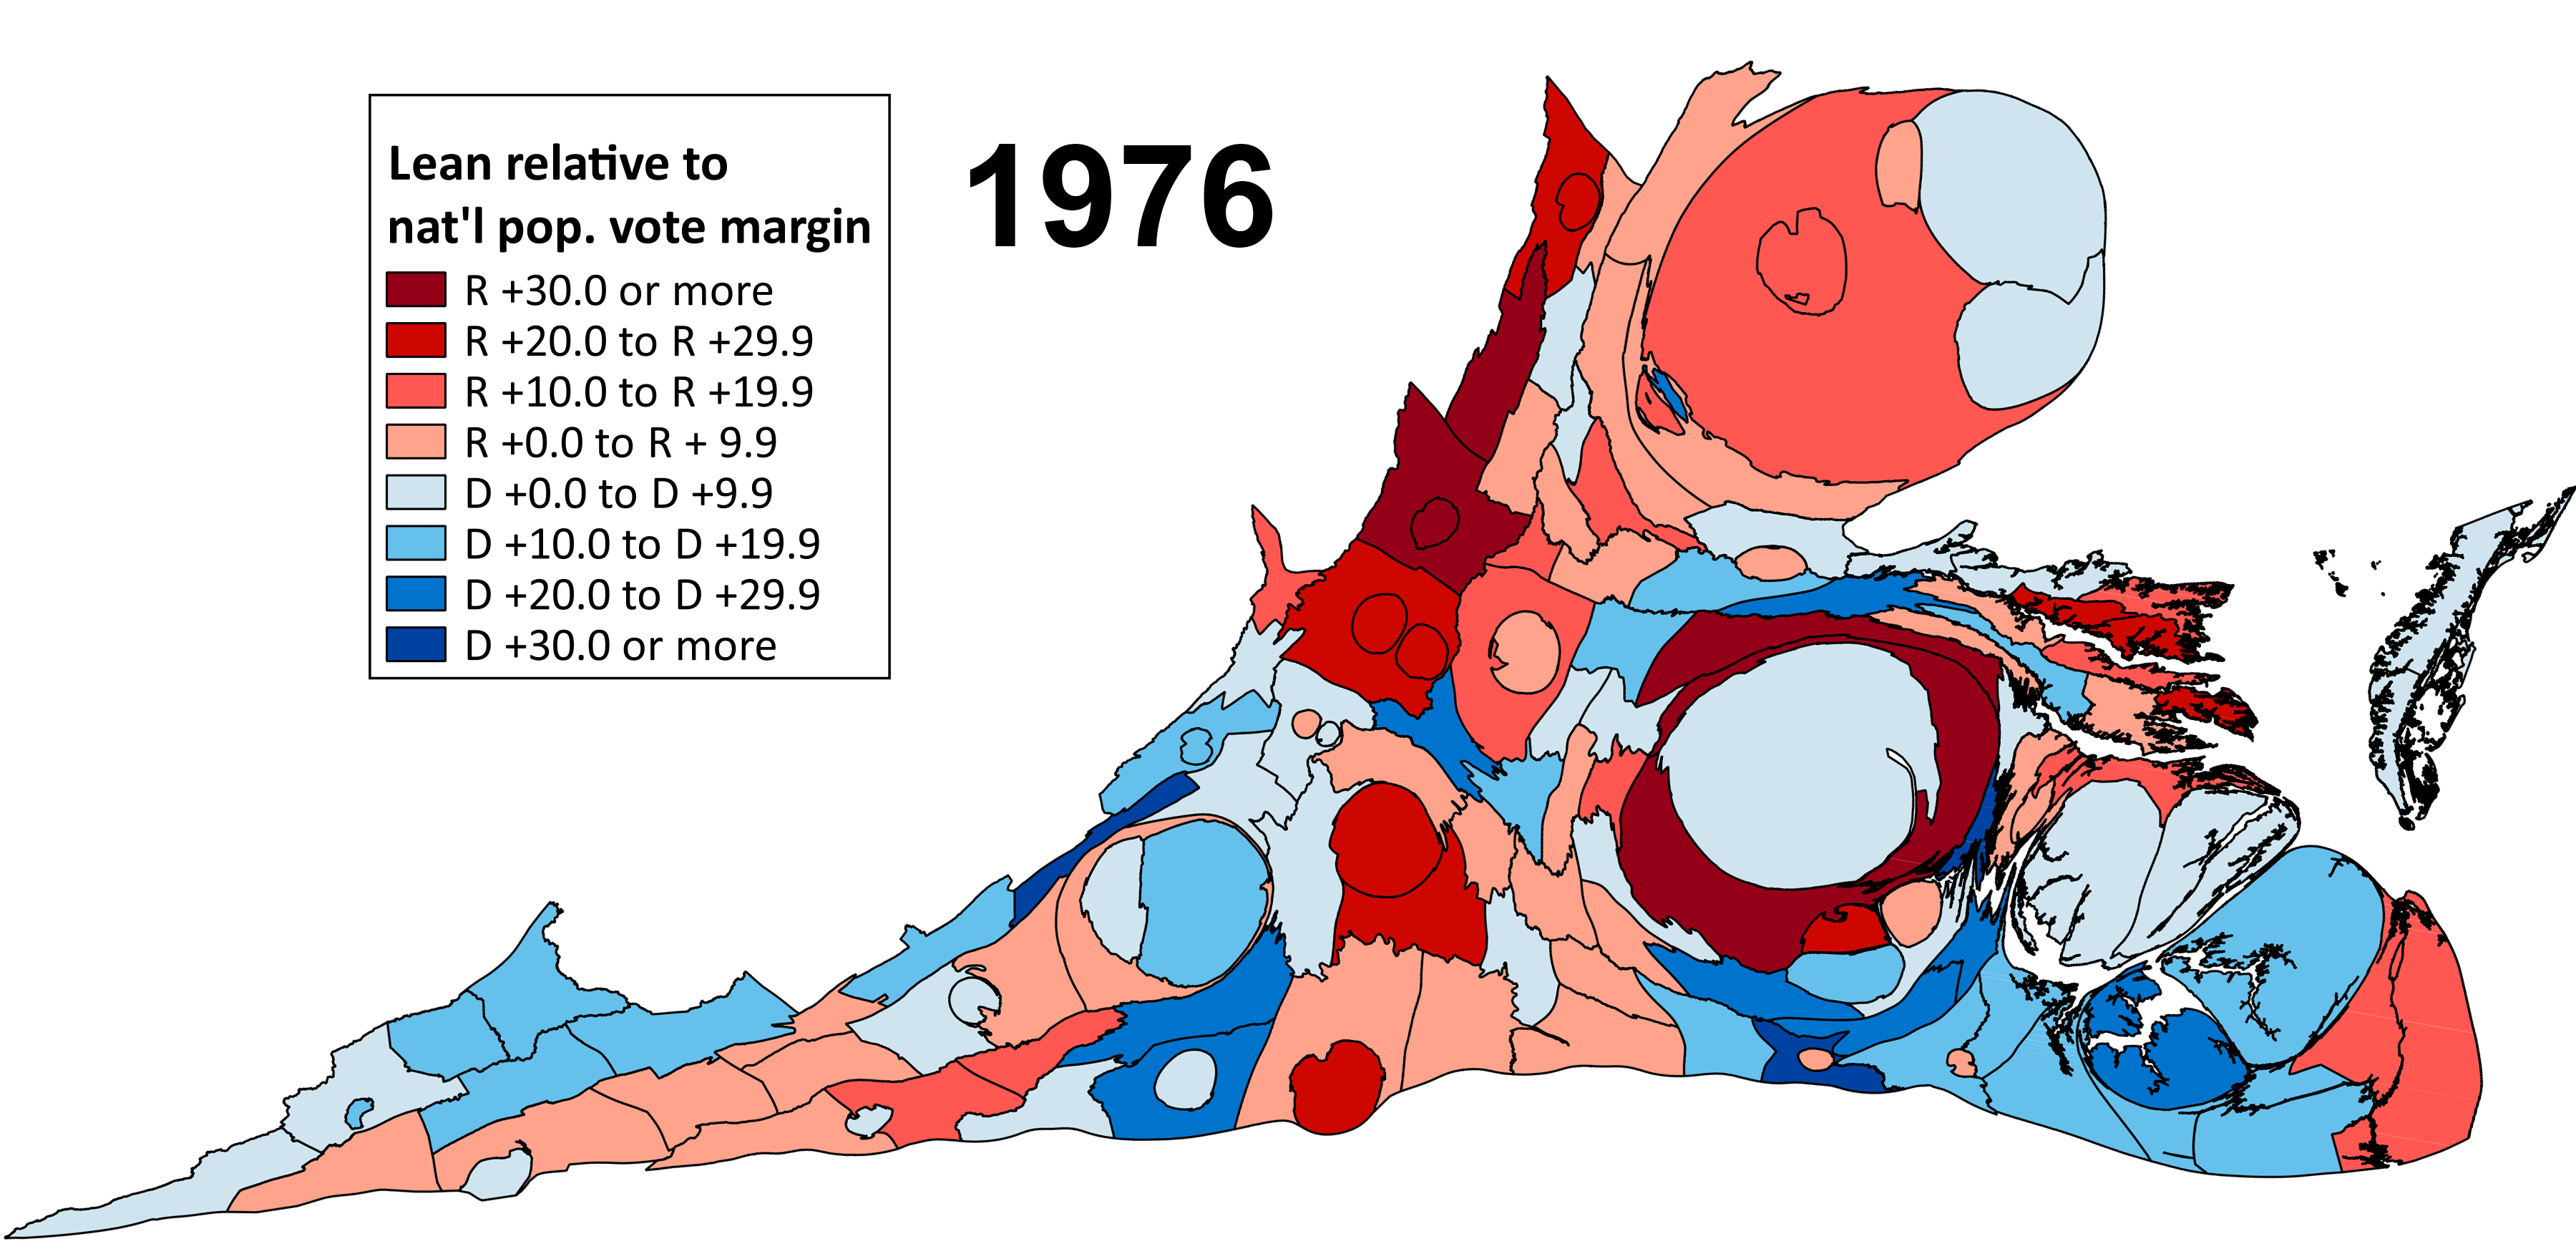
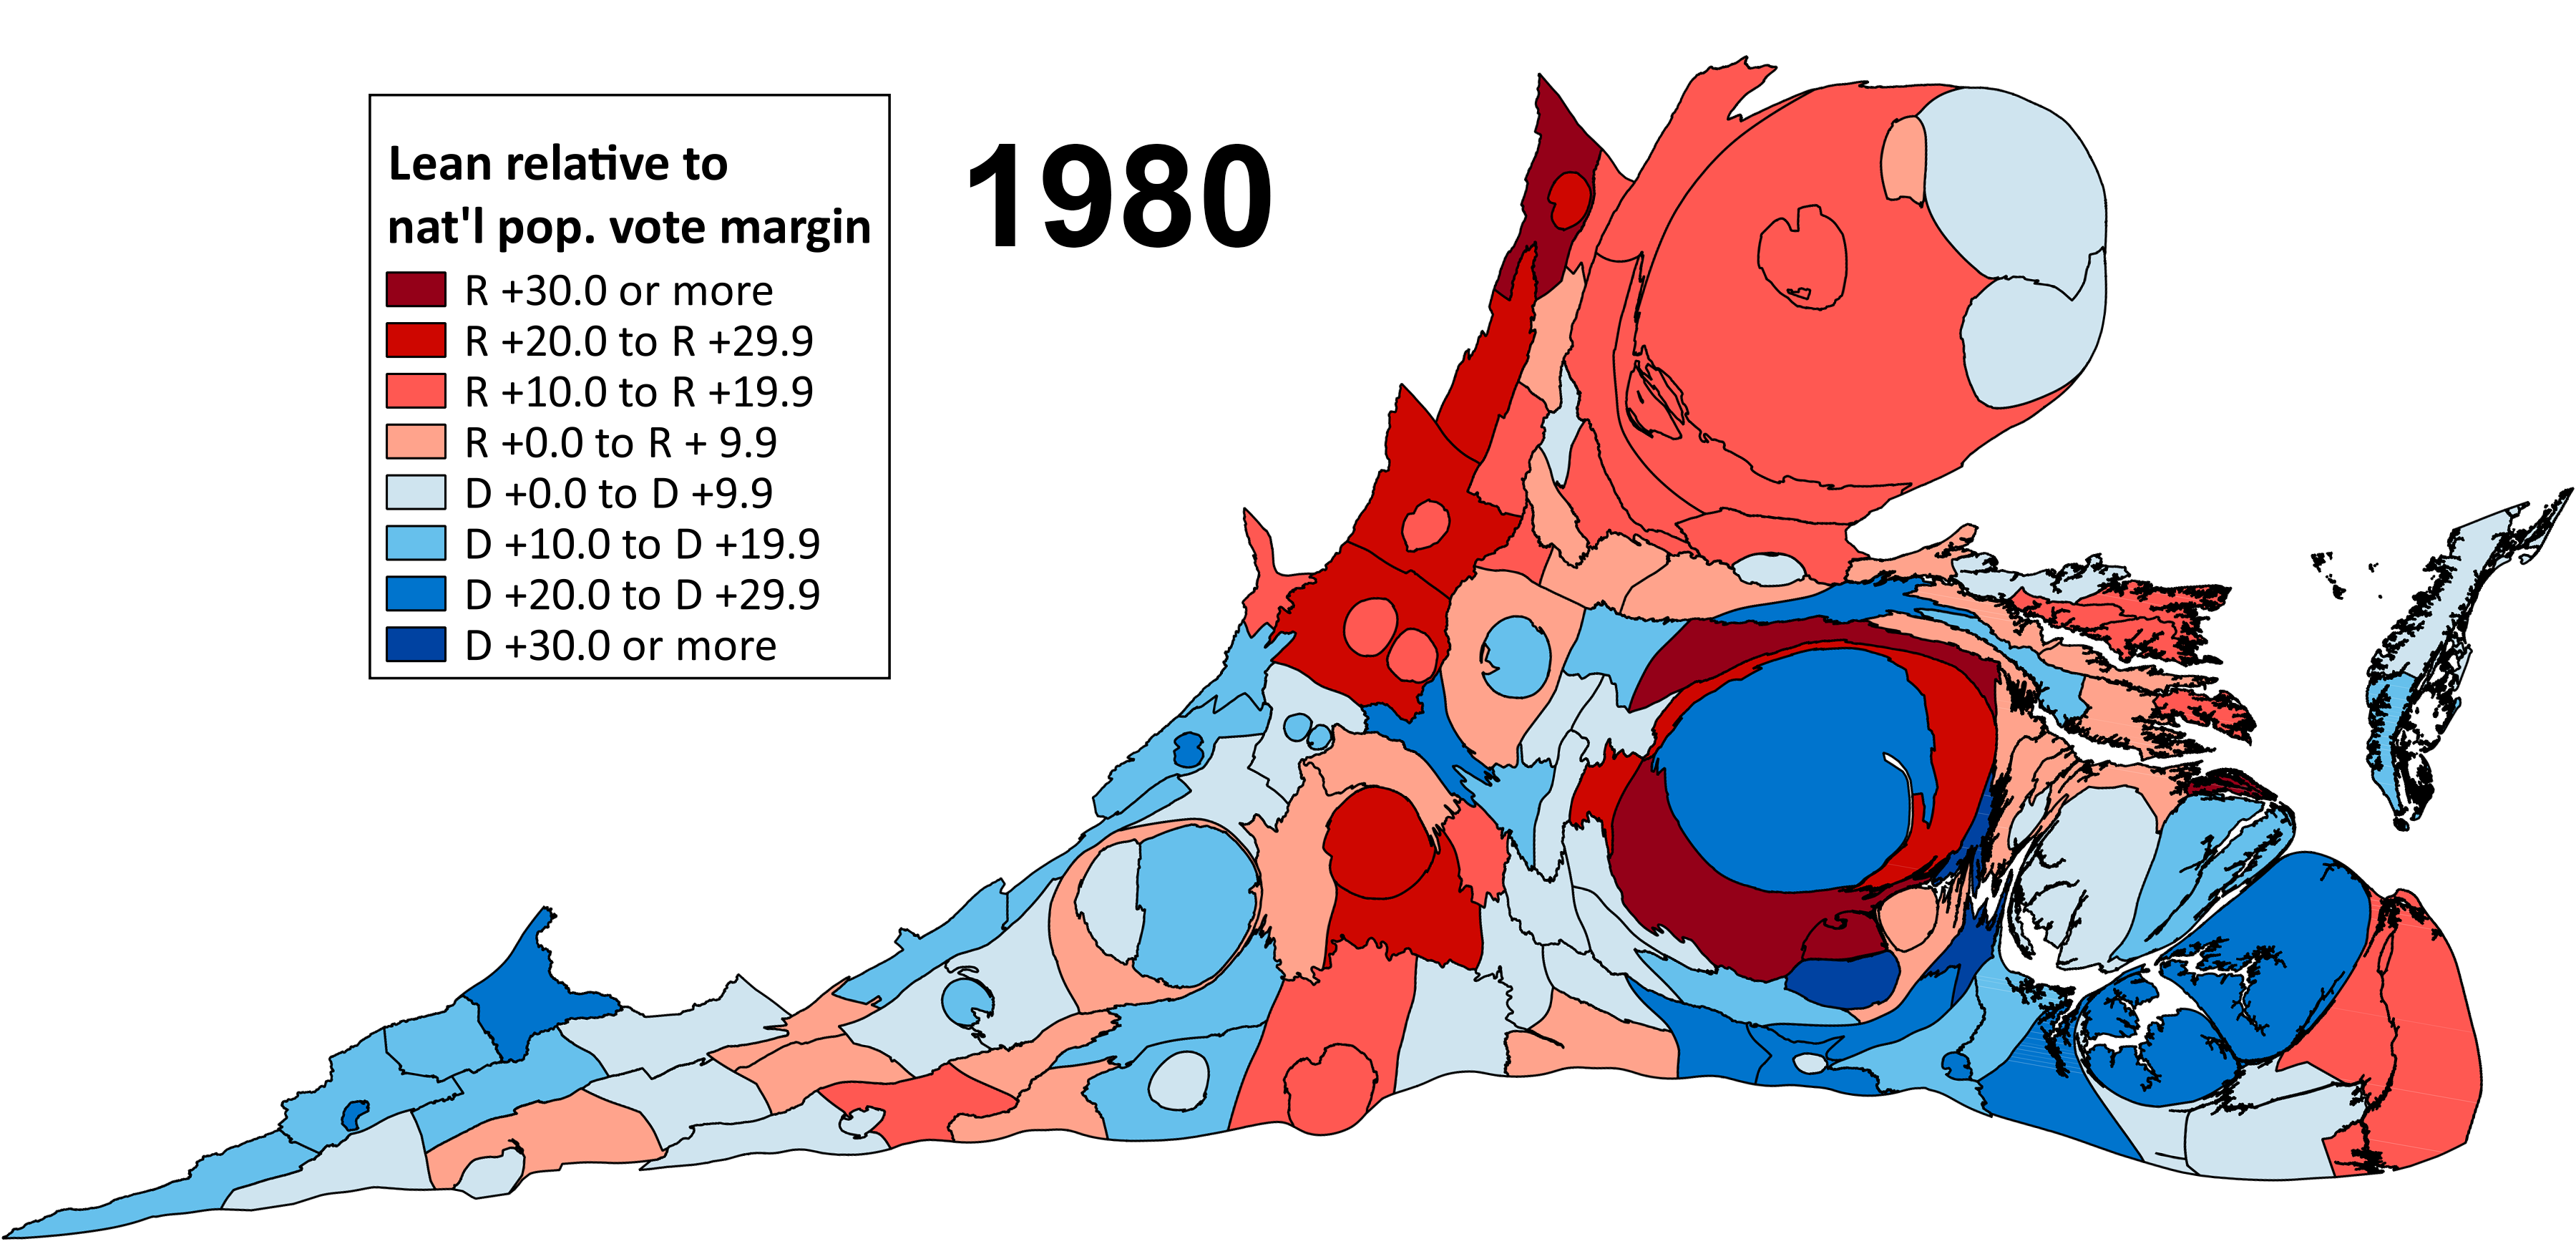
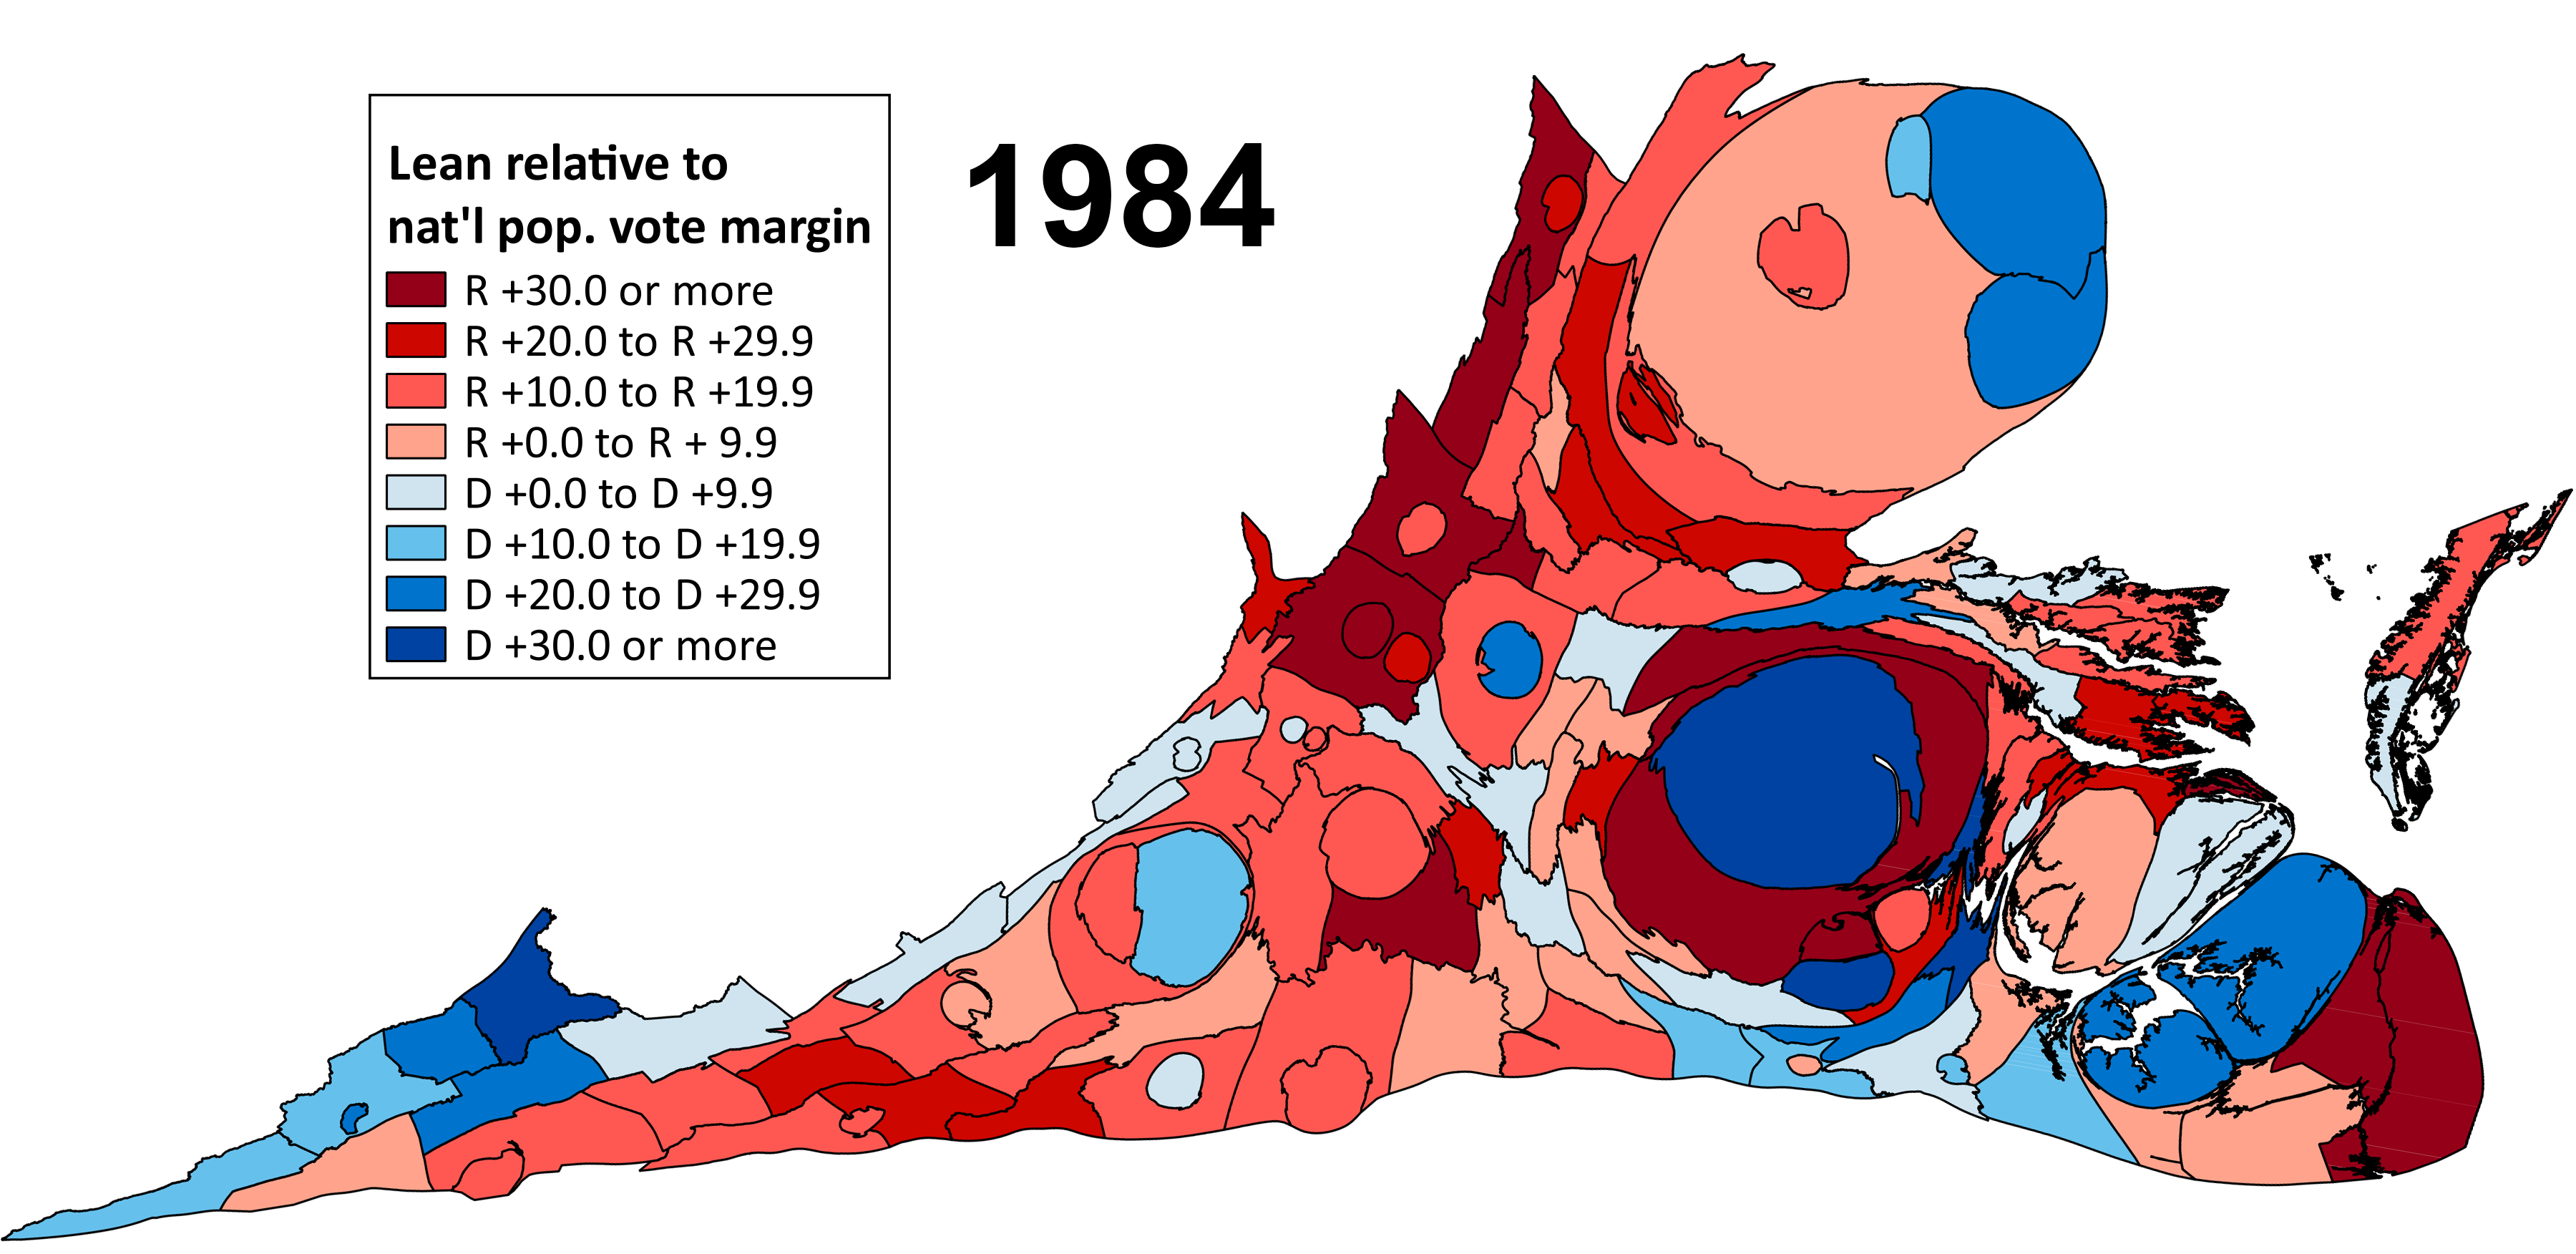
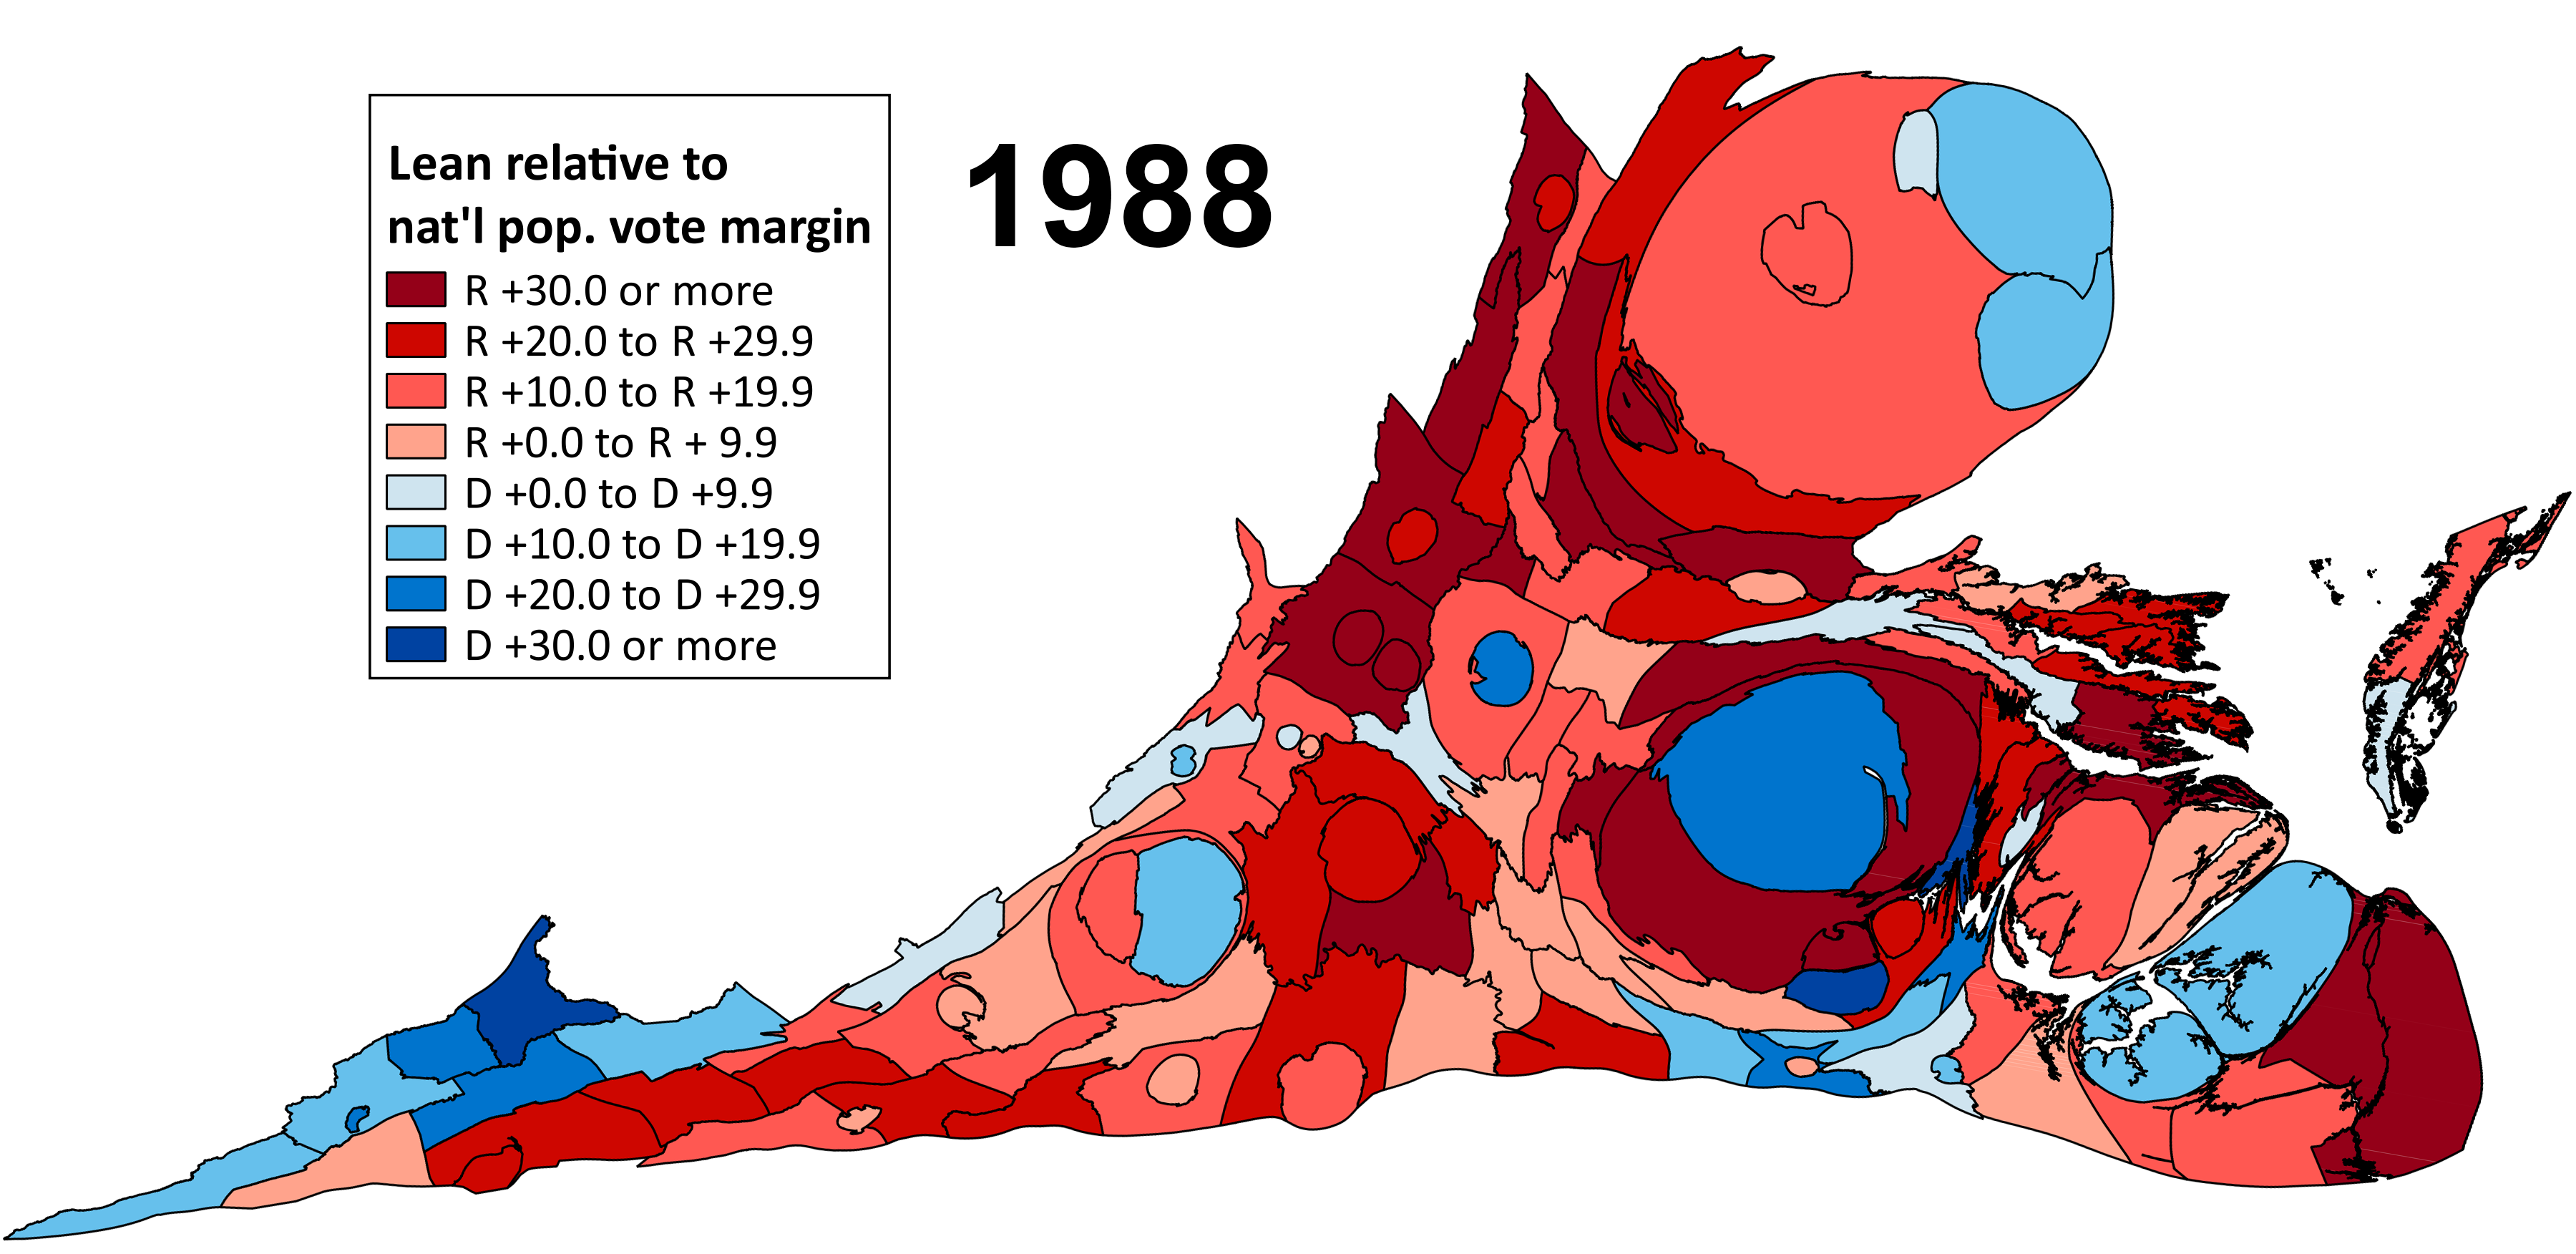
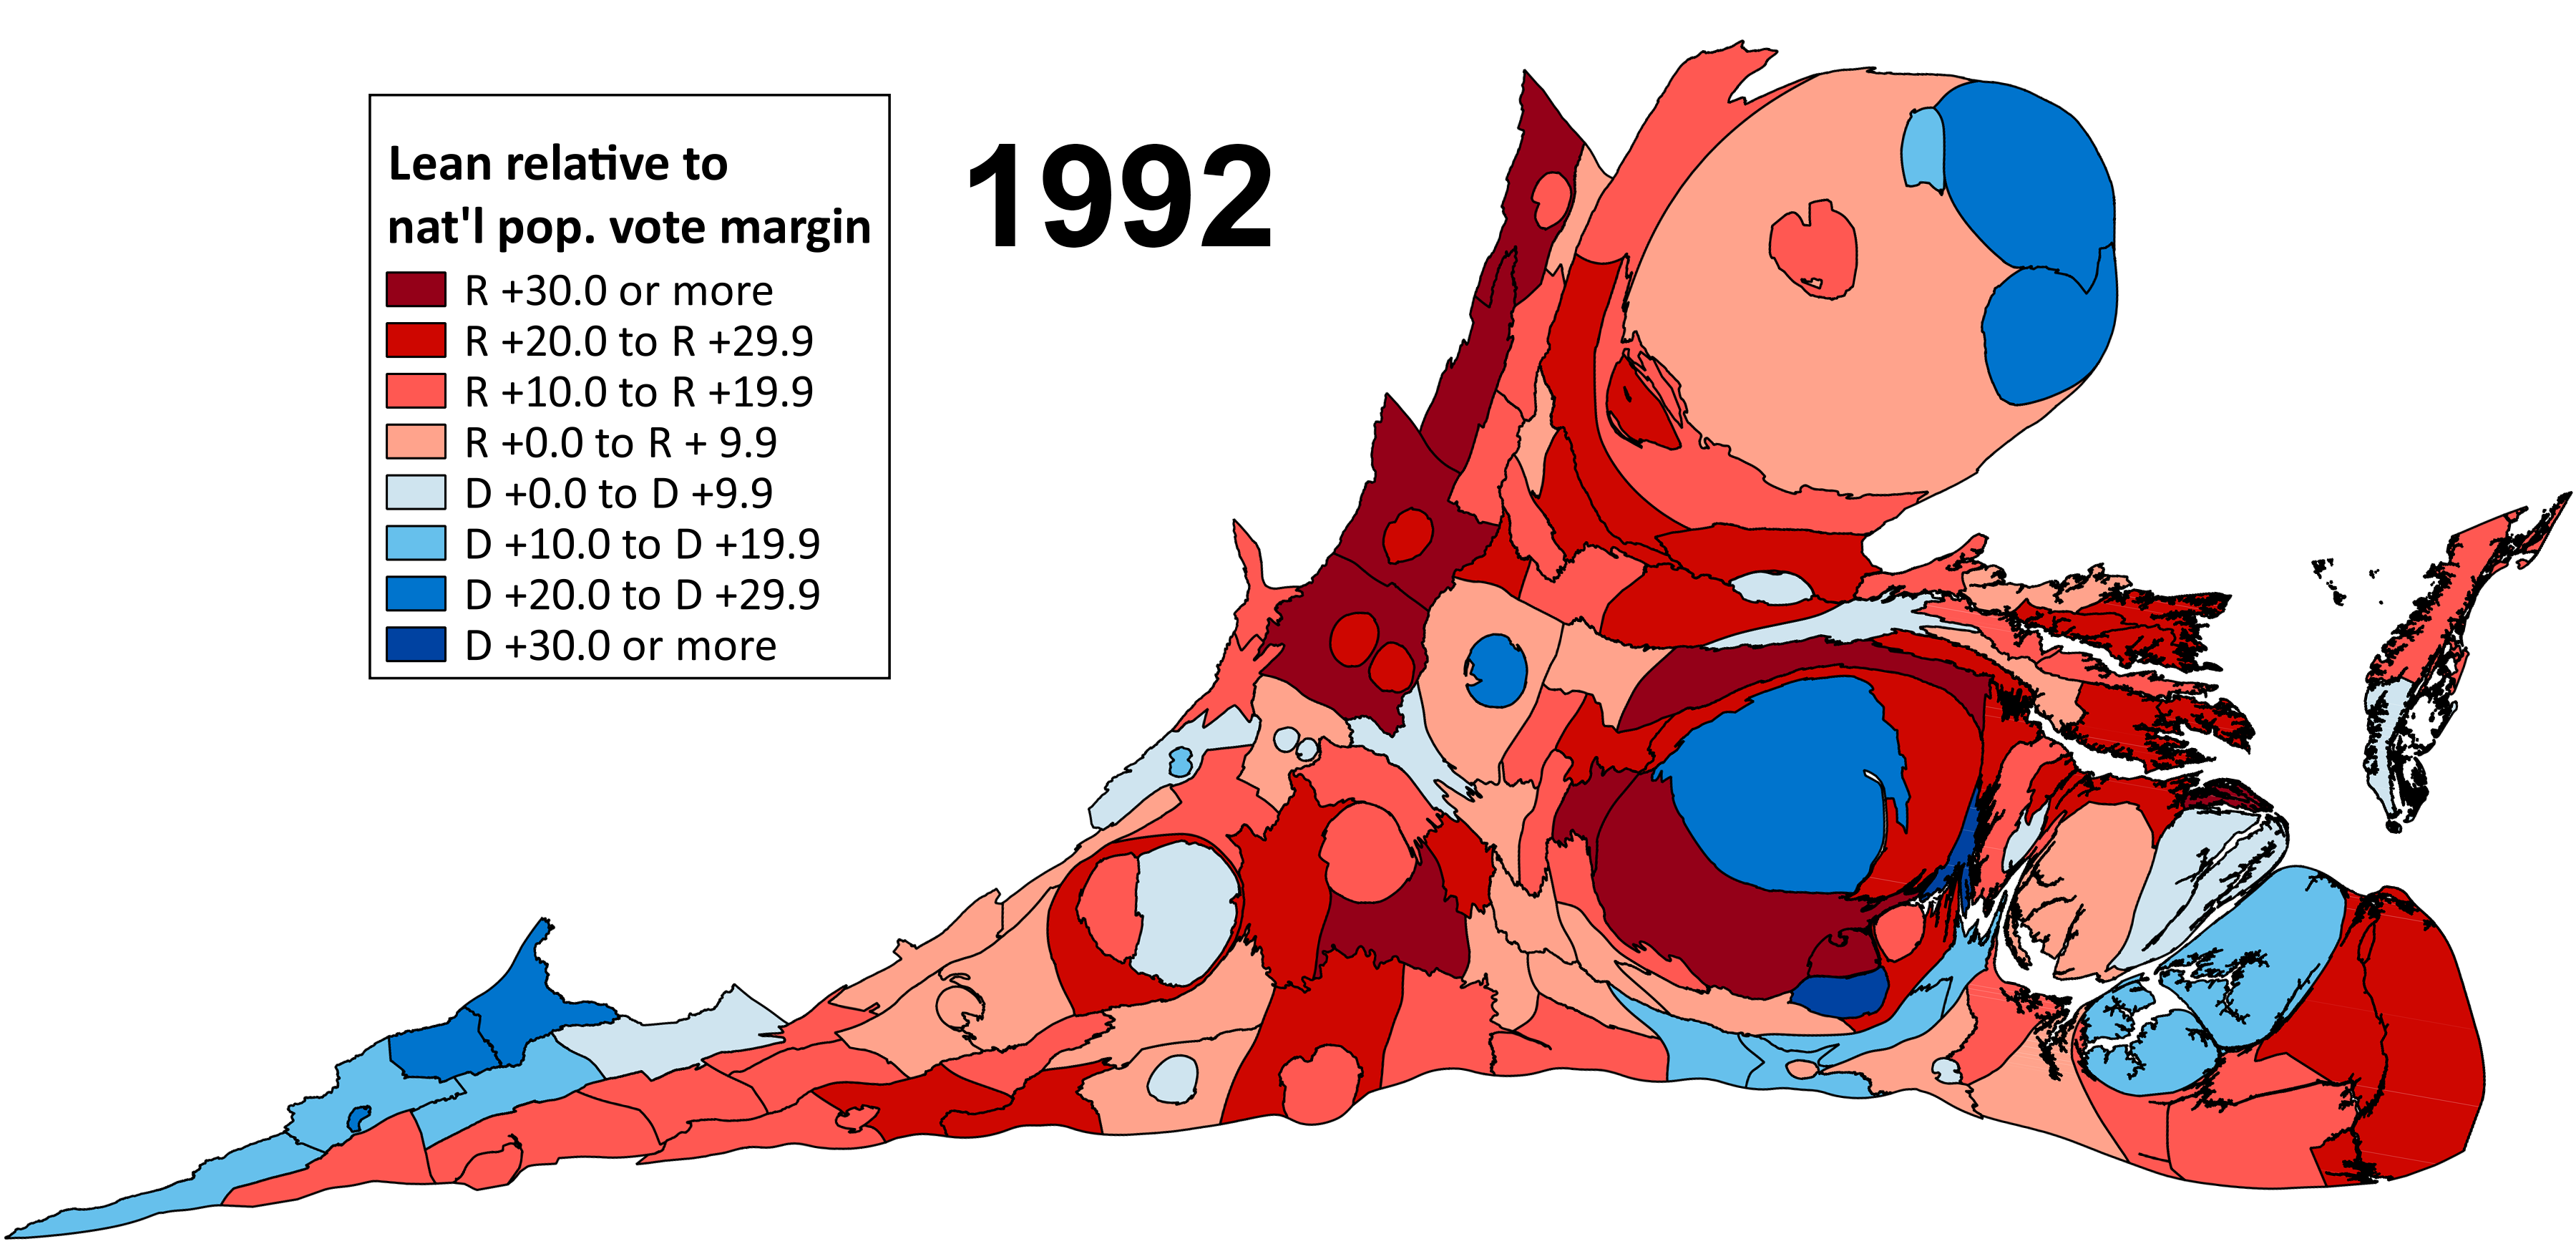
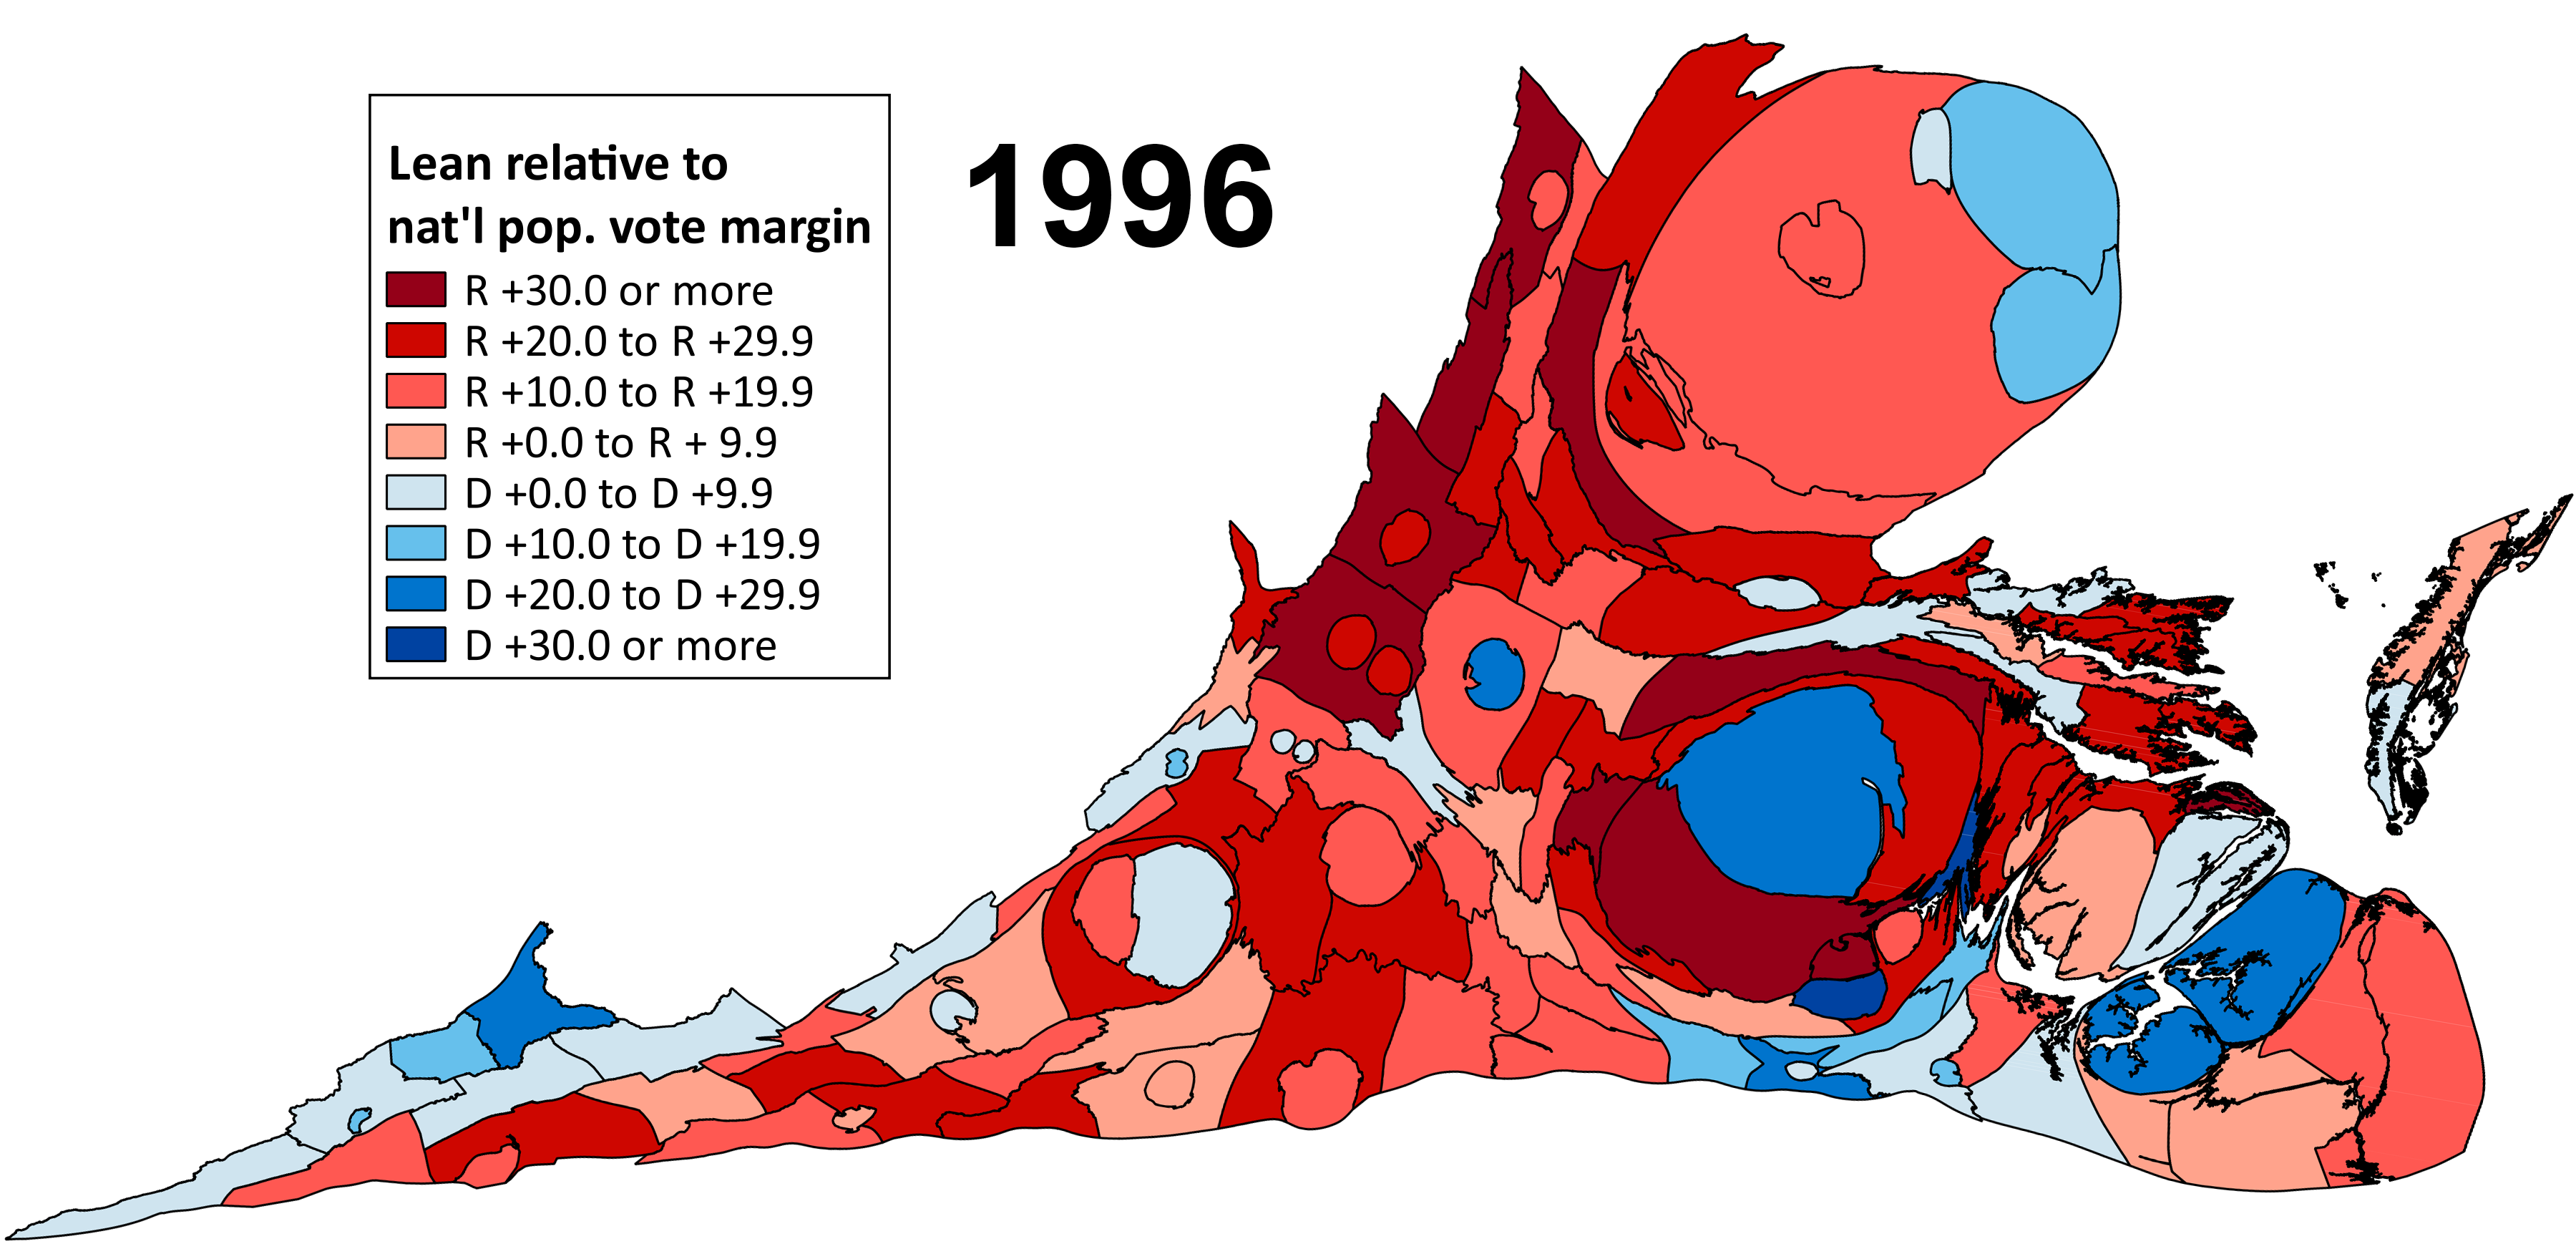
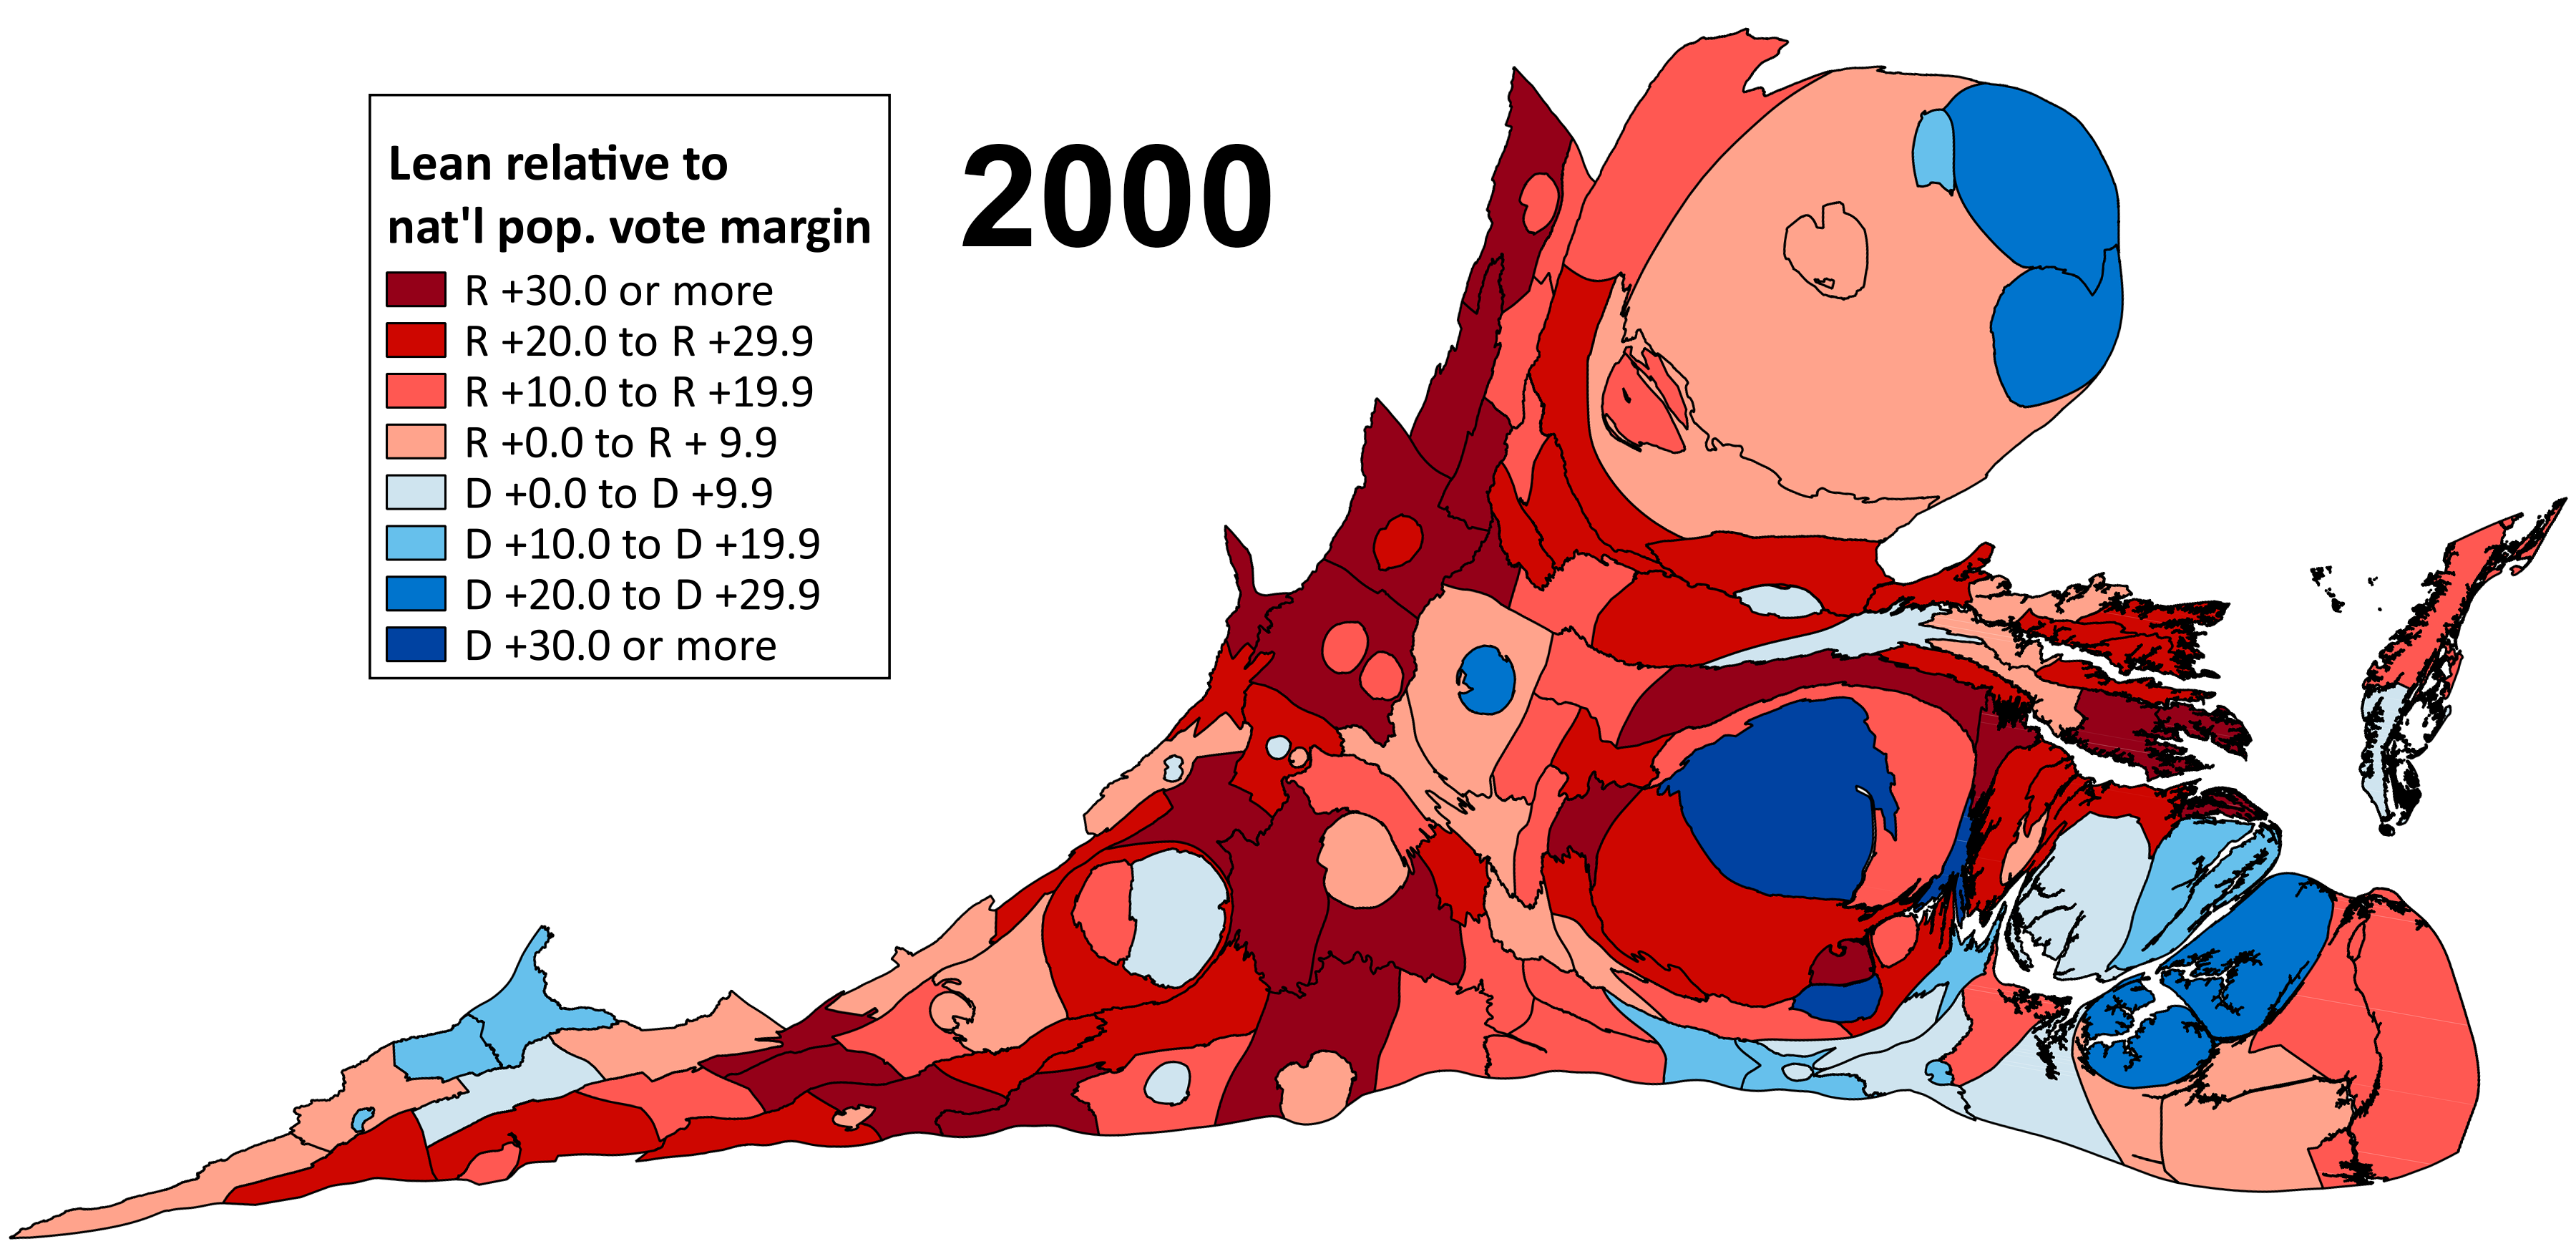
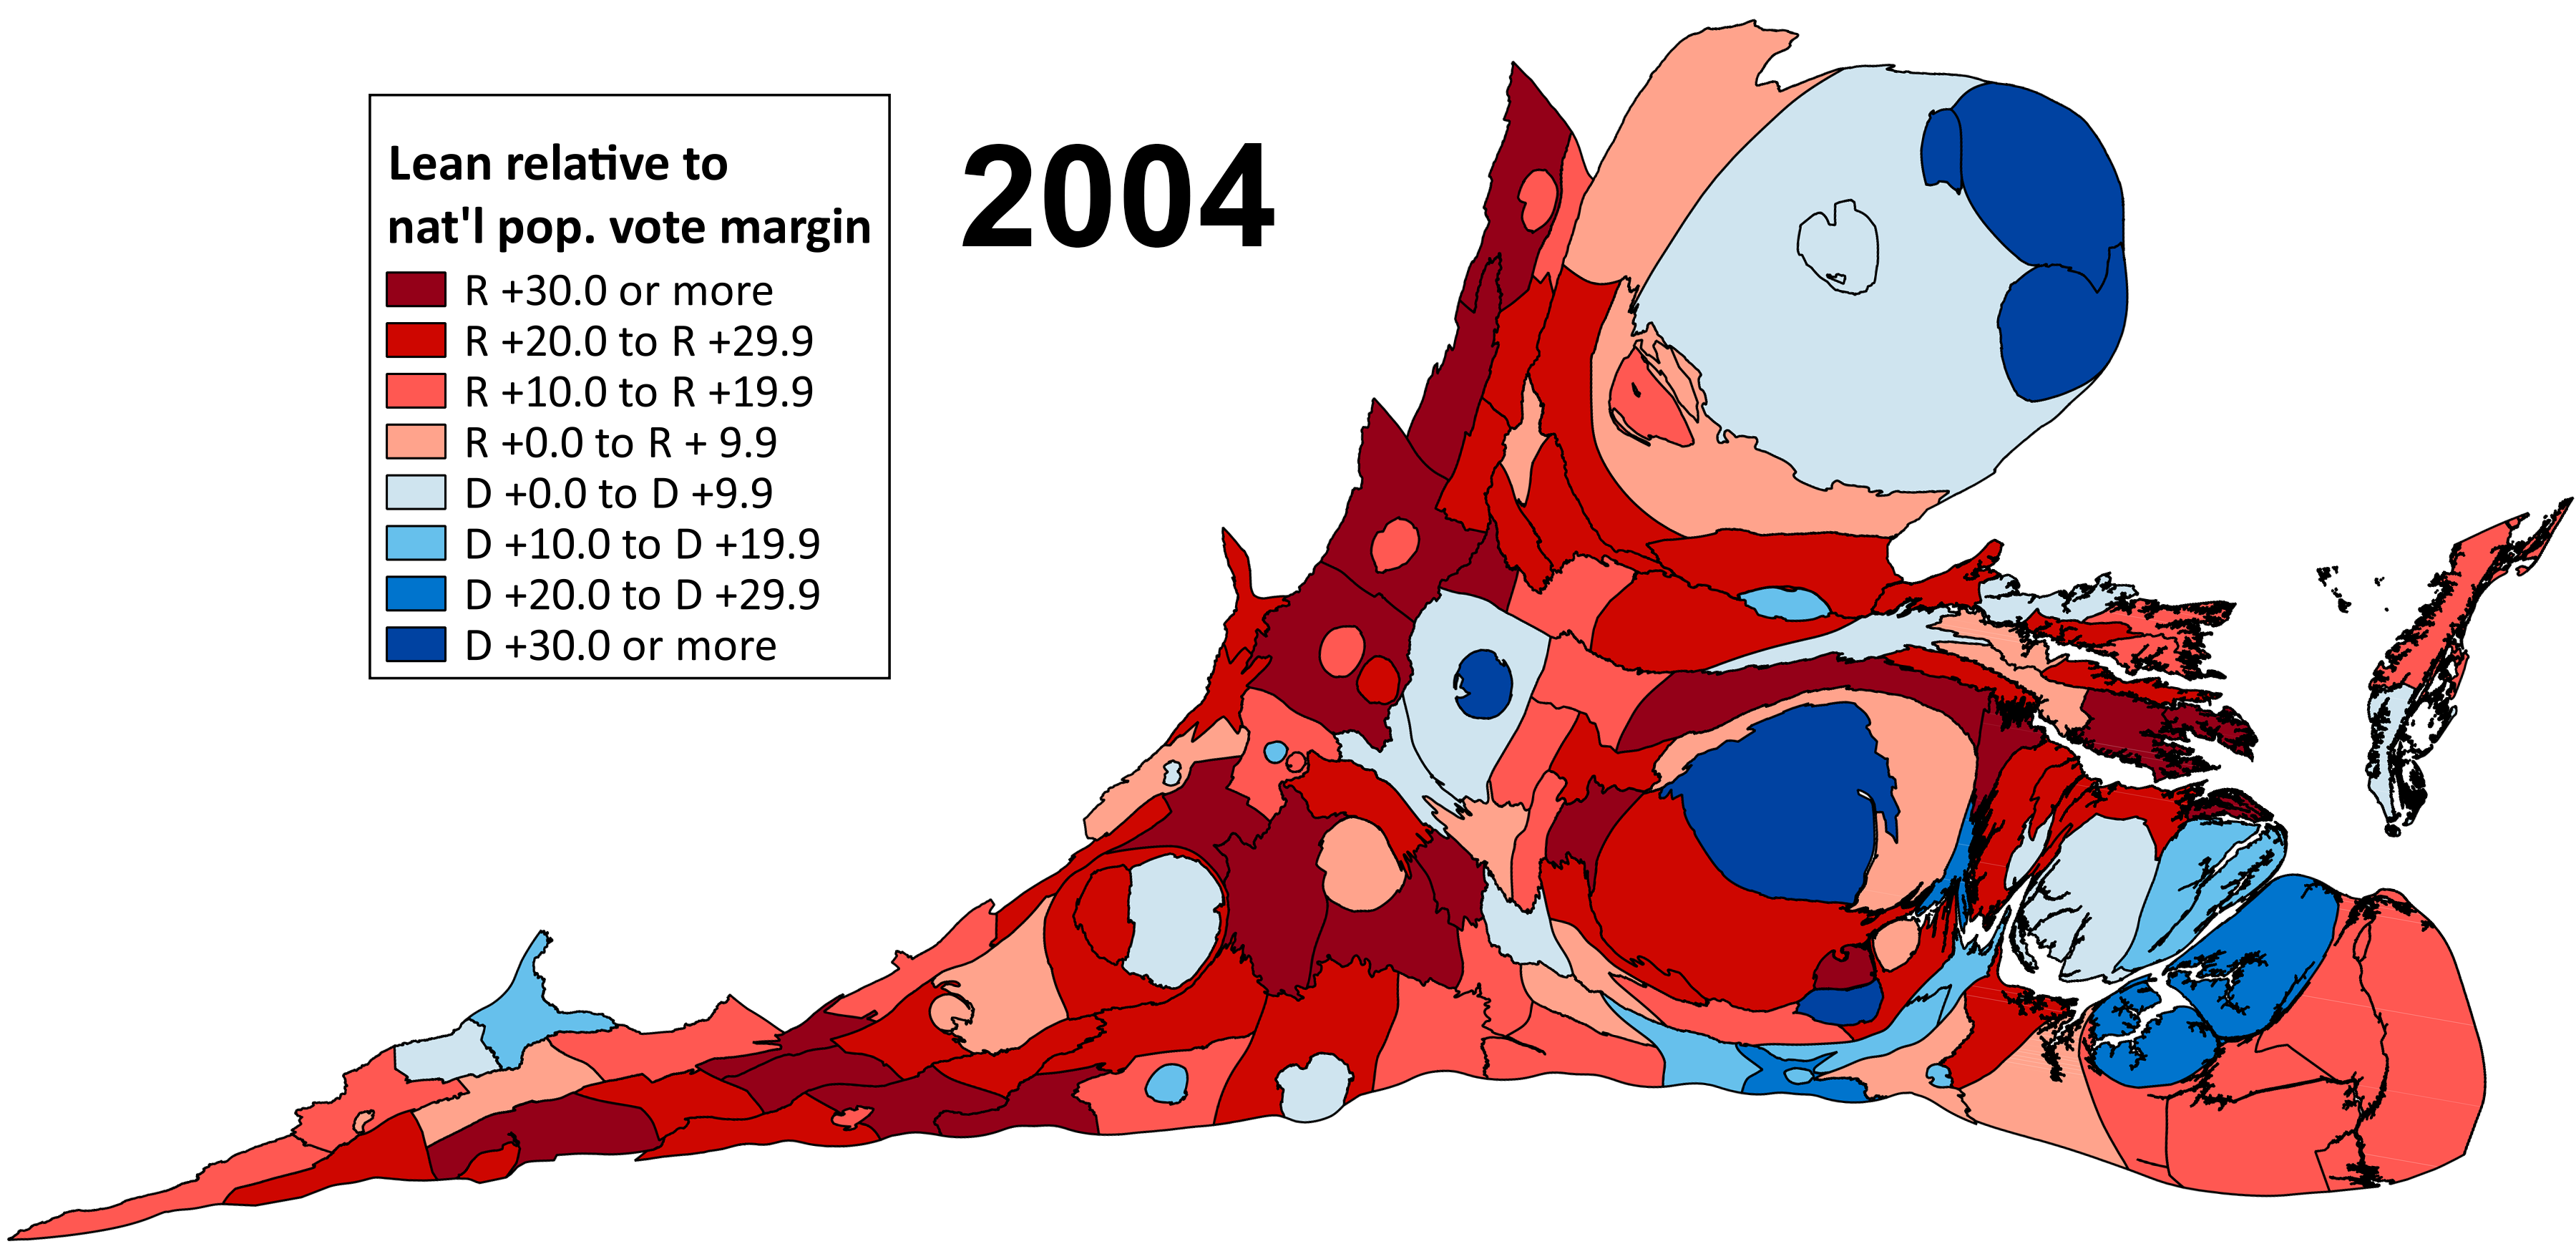
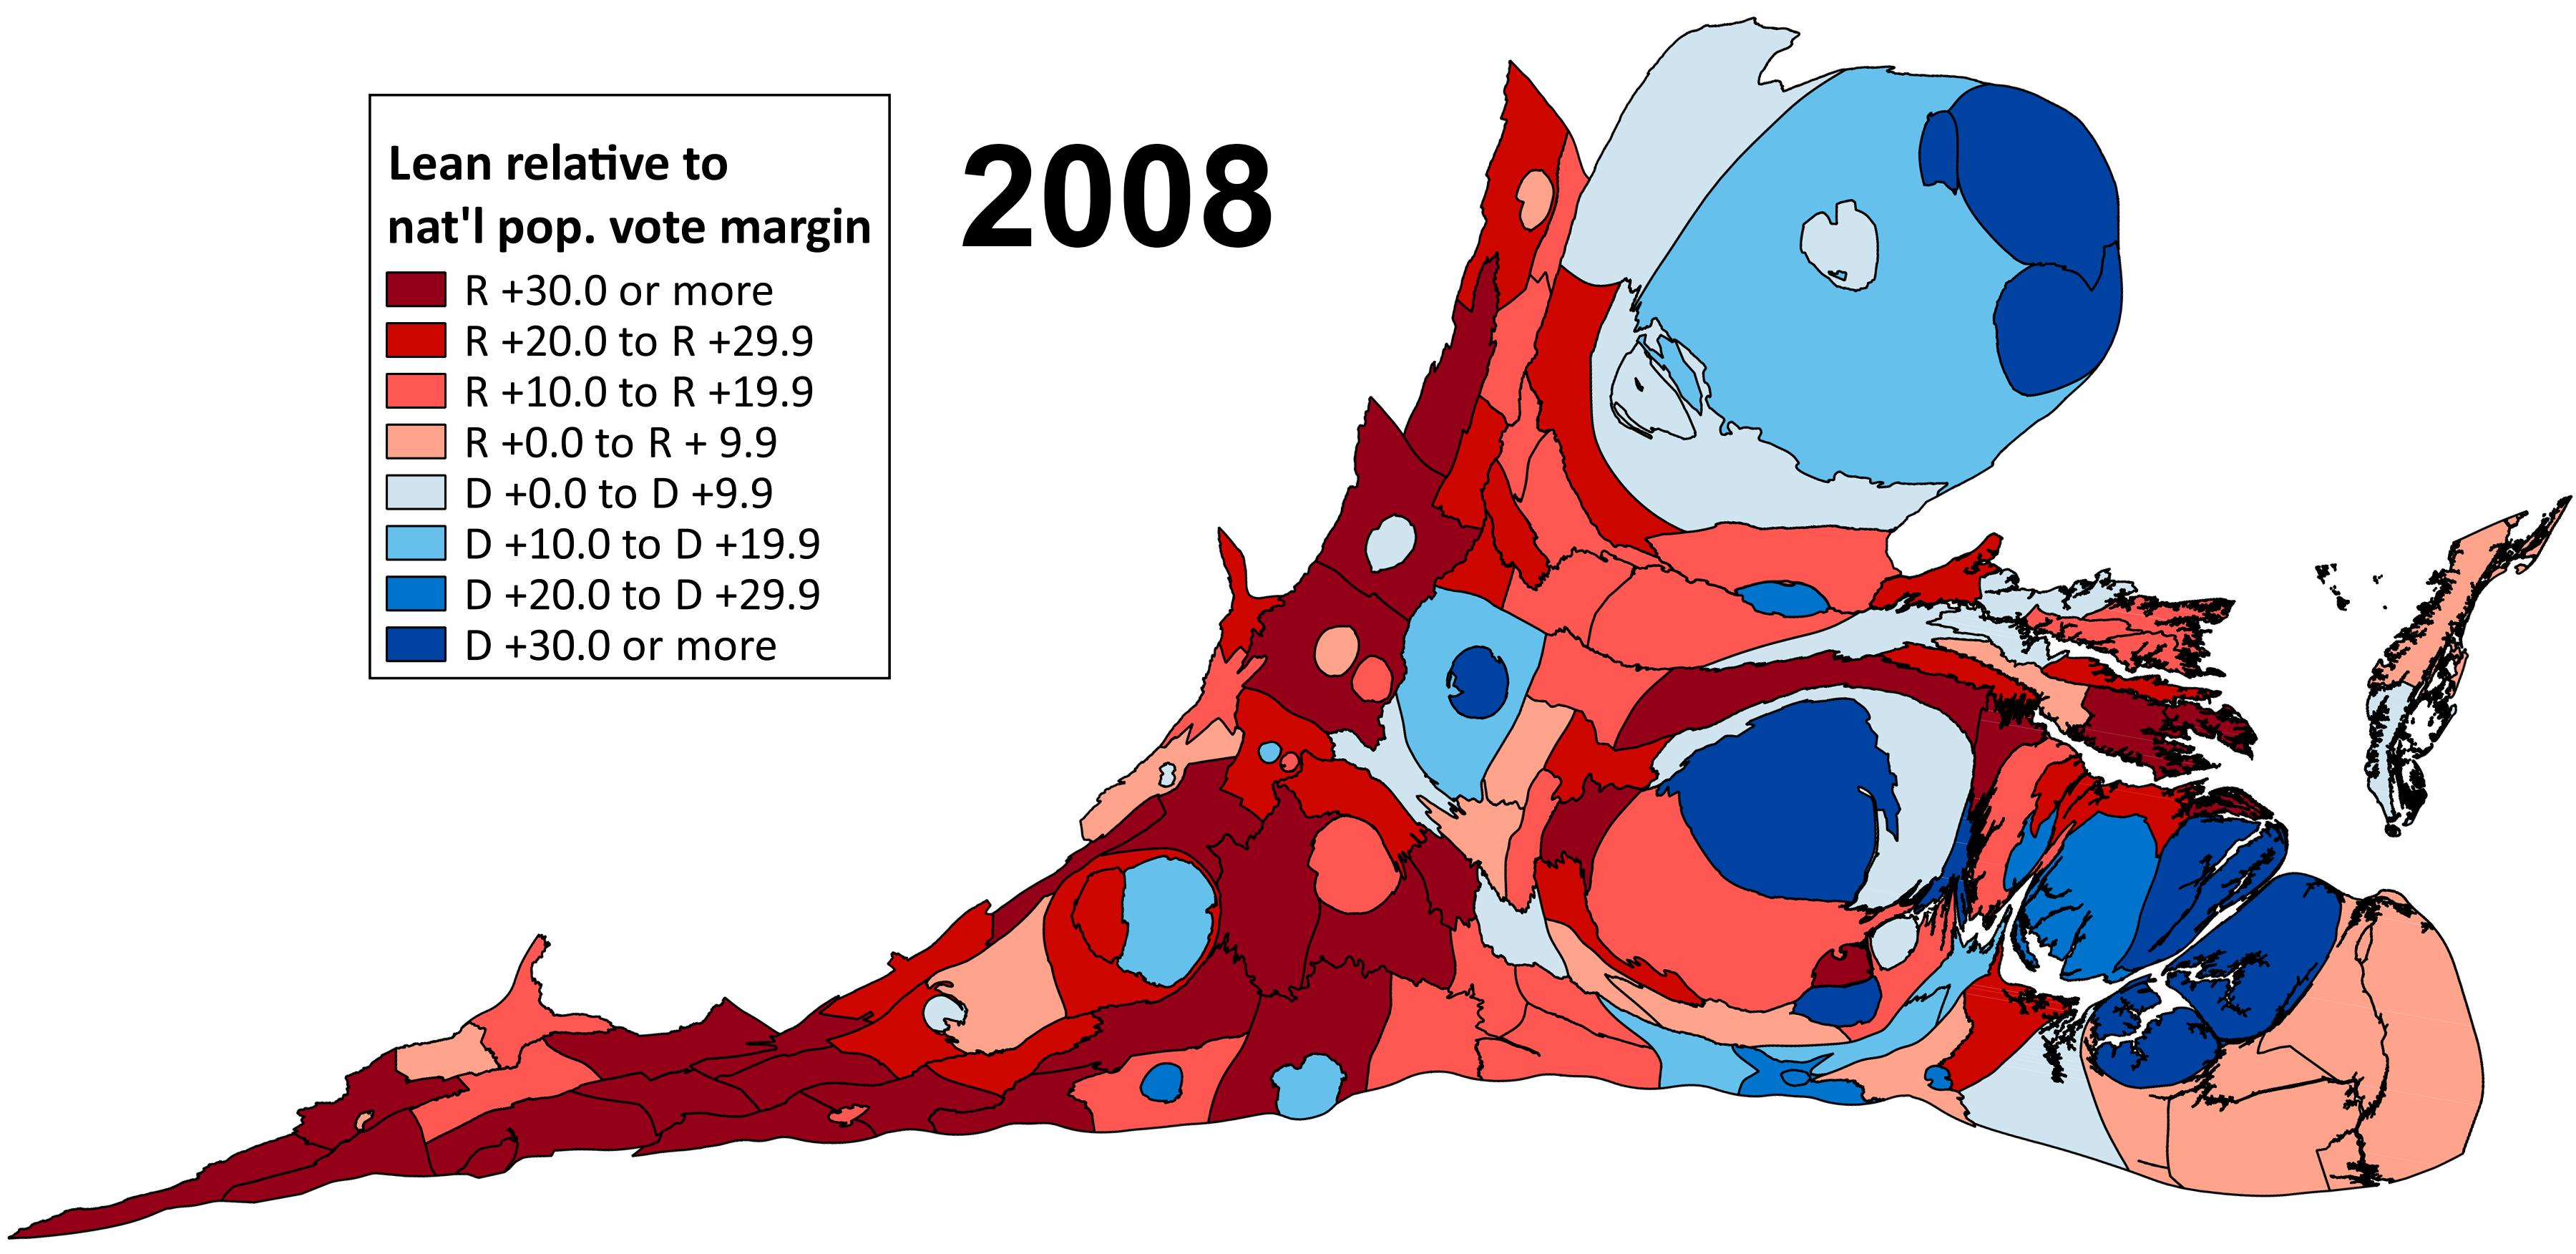
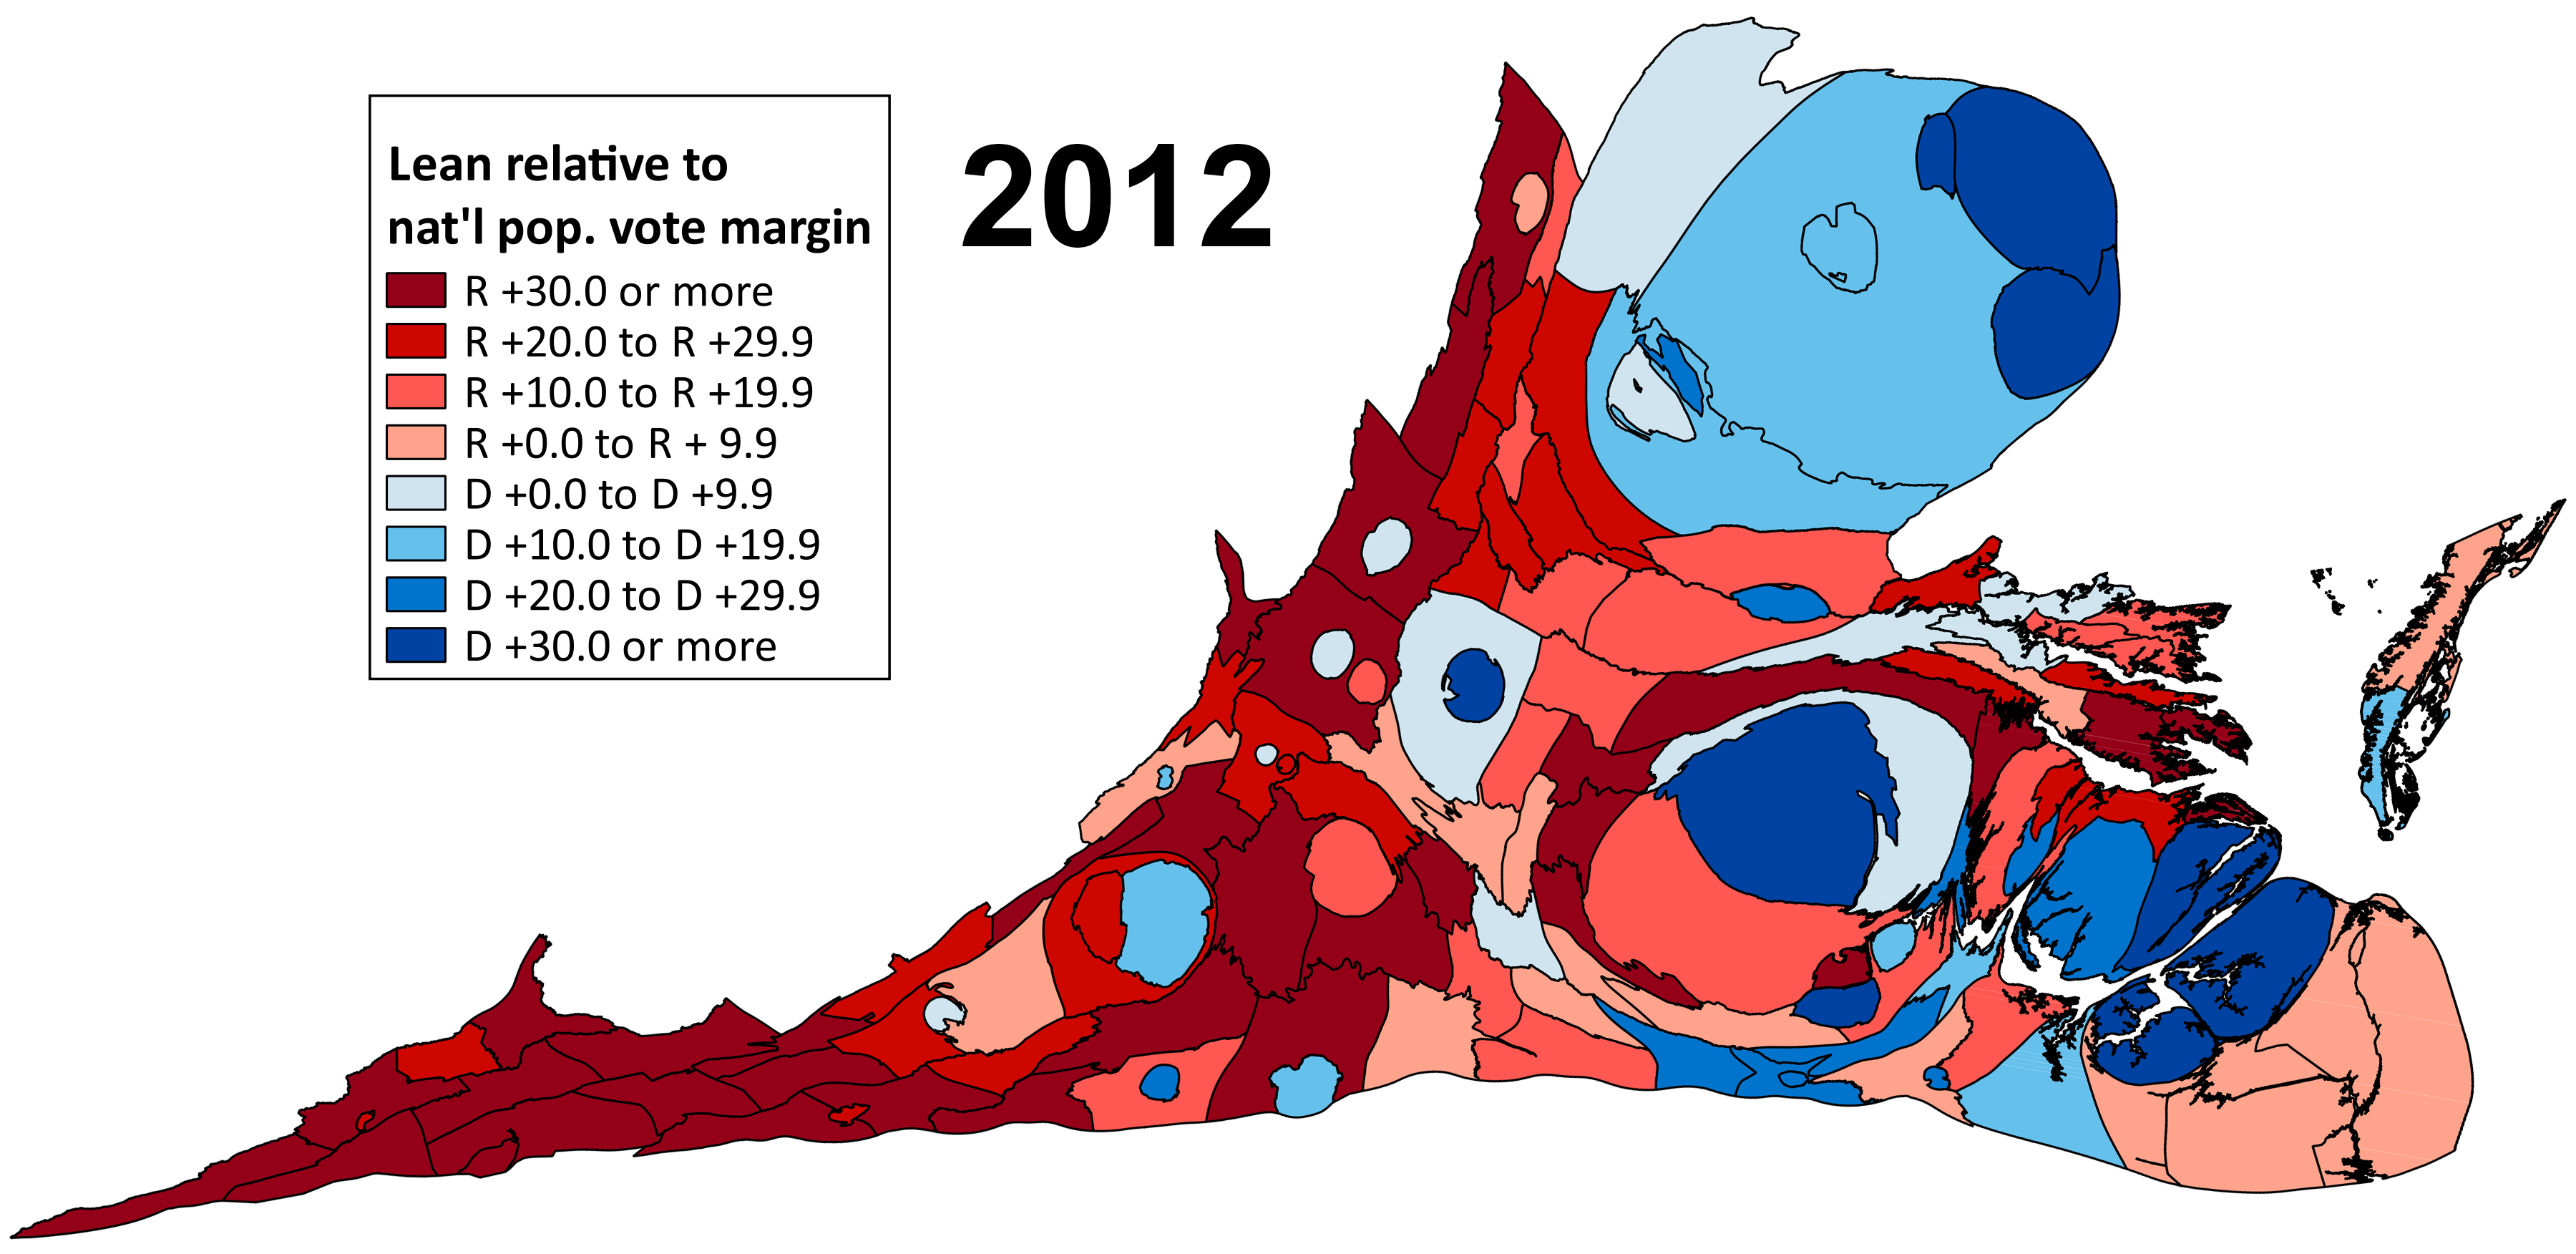
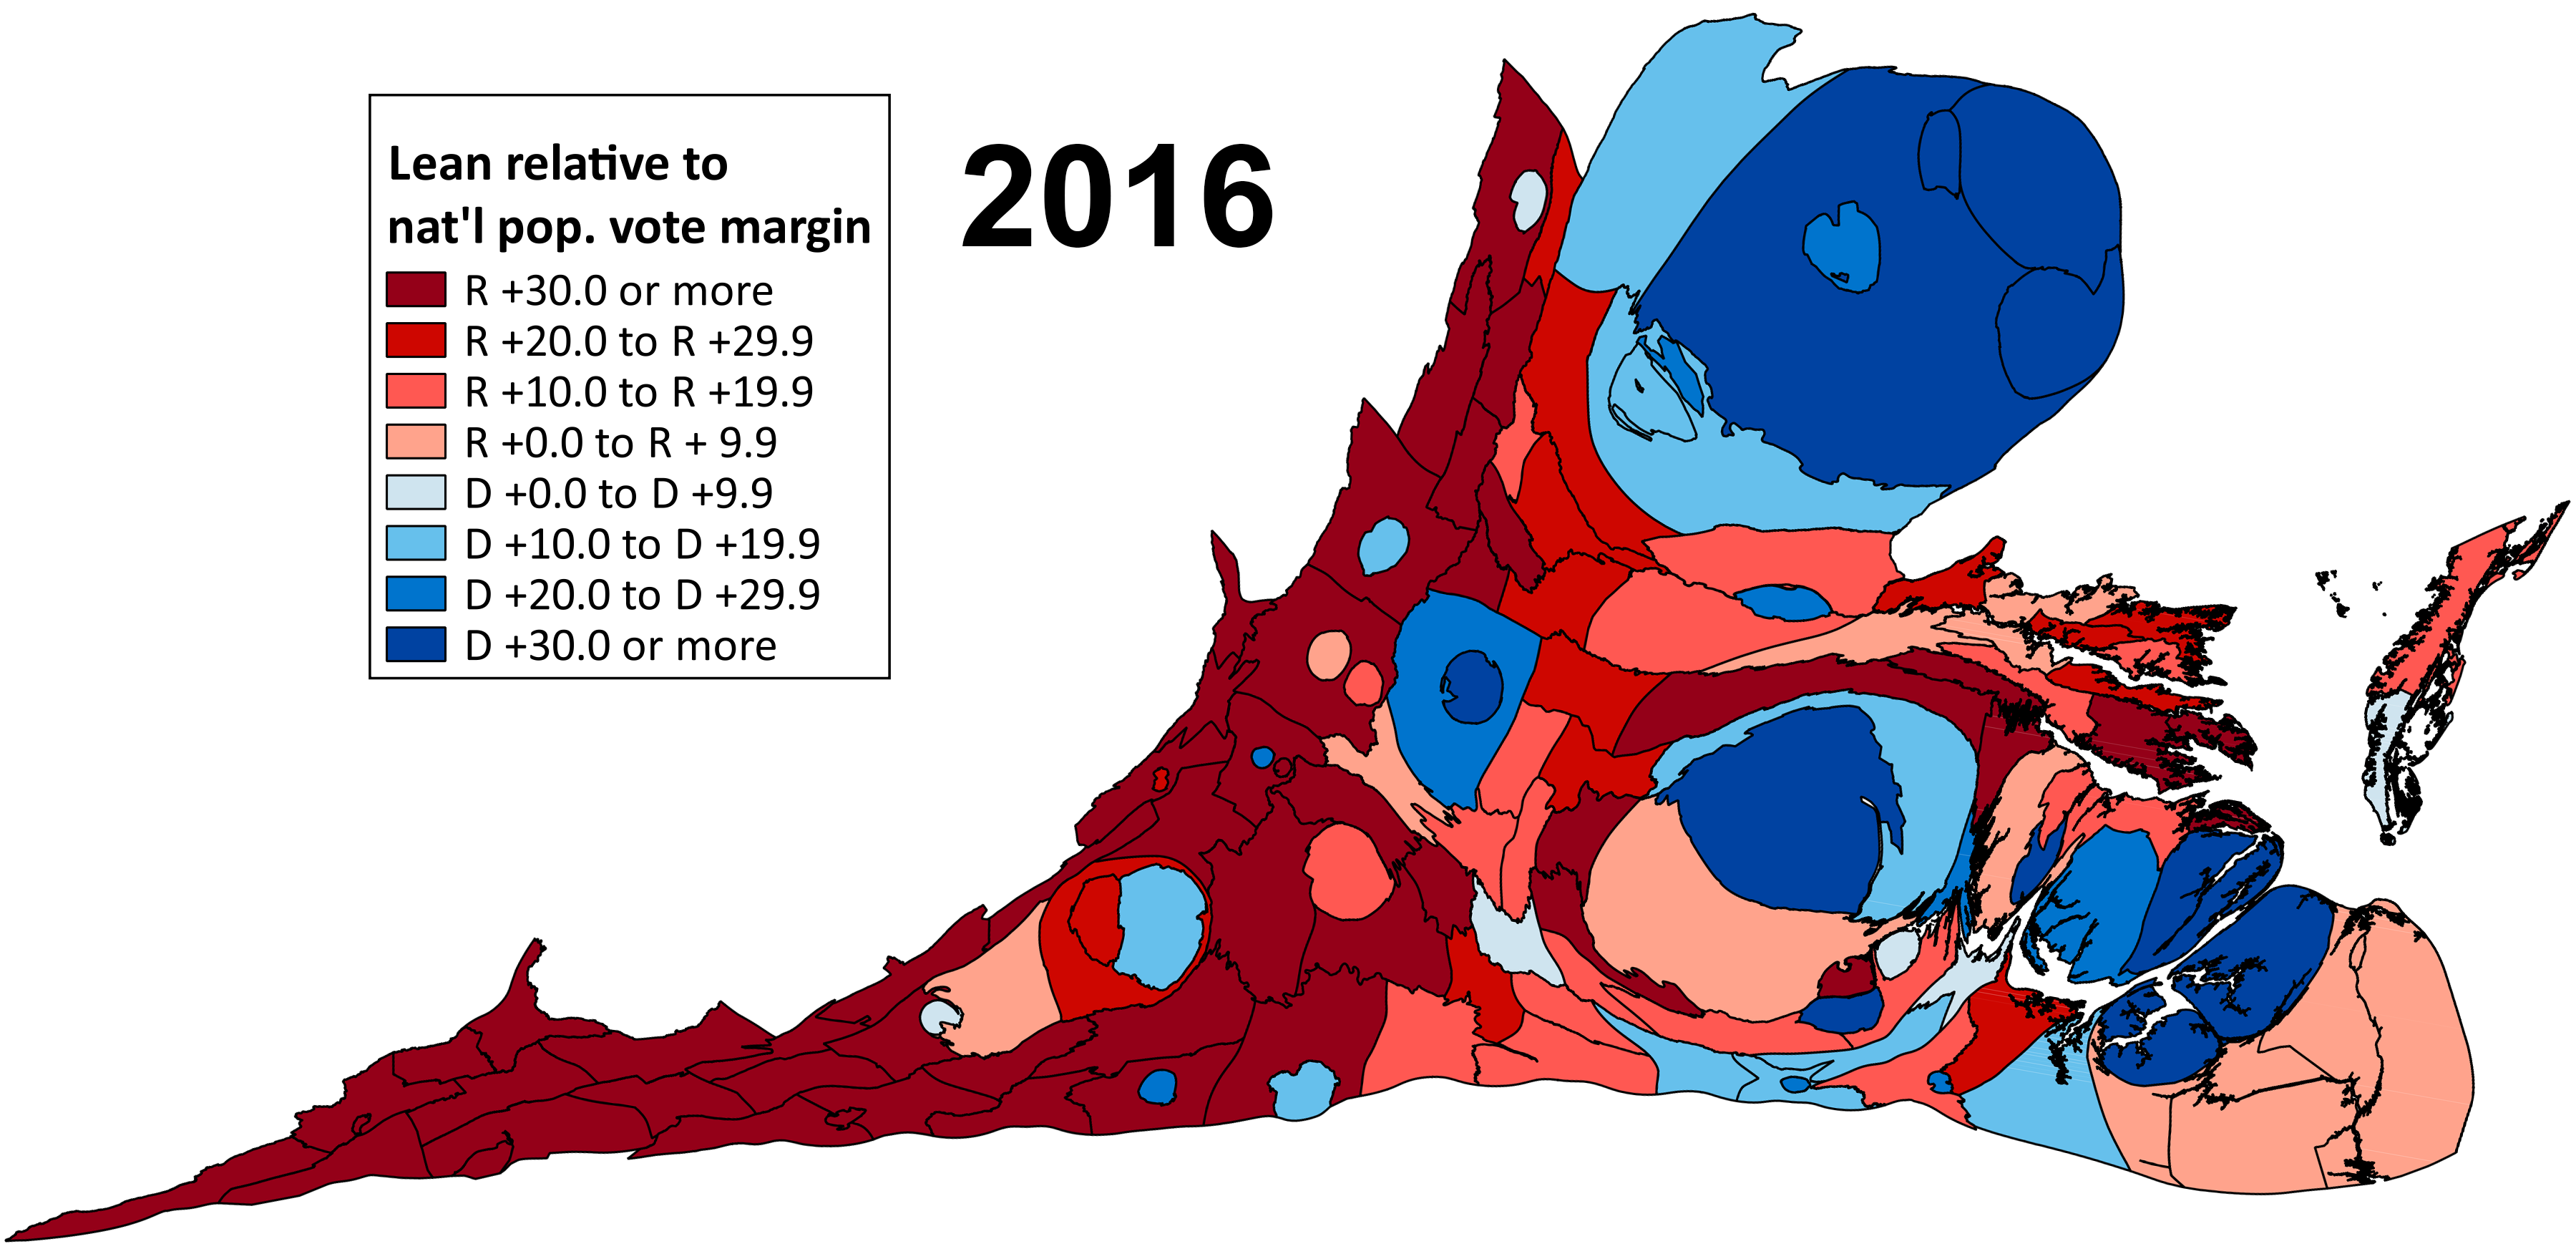
Below is a GIF of cartograms of Virginia, going from 1968 to 2016. Each map contains the relative partisan lean of Virginia localities (based on today’s localities) compared to the national popular vote in each election. So adjust your eyes — the colors do not represent the straight-forward vote results but each locality’s lean relative to the country as a whole in each election. A cartogram is a useful way to examine a geographical area while taking an unseen factor into account, such as population. In this case, the localities are sized by the share of the vote they made up in each presidential election to better show their voting influence. (If the GIF is not playing automatically, please click on the map image to open it separately.)
Map 1: Cartogram of Virginia by relative partisan lean, 1968 to 2016

Sources: Author’s calculations based on Virginia Department of Elections data, map shapefile adjusted using QGIS’s Cartogram plug-in.
Notes: Election results for Manassas and Manassas Park in 1968 and 1972 were unavailable (they were part of Prince William County until 1975). Their sizes are weighted by their population as a part of Prince William County and they are colored by the overall partisan lean of Prince William County for those two elections. The City of Fairfax (in the middle of Fairfax County) is oversized due to the fact that Fairfax County’s judicial complex is located within its city limit, which affected the algorithm that altered the shapefile. To see images of the individual maps, click on the following: 1968, 1972, 1976, 1980, 1984, 1988, 1992, 1996, 2000, 2004, 2008, 2012, 2016.
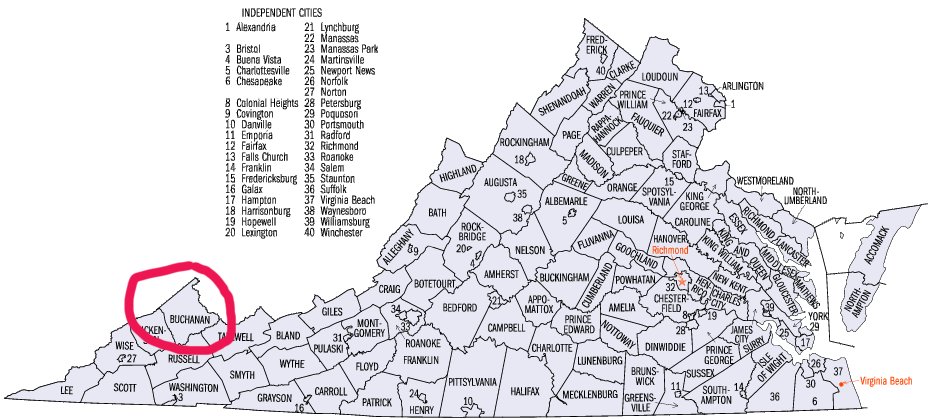
These maps show the dramatic electoral changes that have taken place in Virginia over the past five decades. Note the growth of Northern Virginia, particularly in the share of the vote in Loudoun and Prince William counties, which are directly west and south, respectively, of Fairfax County. Meanwhile, note the bluing of that region, specifically from 2000 on. A reddening trend occurs in other parts of Virginia, particularly Southwest Virginia, which was once relatively Democratic. Buchanan County, located in Virginia’s coalfields, holds the honor of having the largest difference between its most Democratic- and Republican-leaning years over the 1968 to 2016 period: In 1984, while Ronald Reagan was winning a landslide reelection over Walter Mondale, Buchanan was 39.5 points more Democratic than the country as a whole. In 2016, Buchanan mirrored its neighbor to the north, West Virginia, and moved very sharply toward Trump — it wound up being 62.4 points more Republican than the U.S. That 102-point difference between its maximum leans for each party is far and away the most for any locality in Virginia from 1968 to 2016. Next-closest was neighboring Craig County, also a major mover in the GOP direction in recent years, at 91 points. As for the place that has seen the largest swing toward Democrats, Charlottesville was 64 points more Democratic than the country in 2016, but back in 1968 it was 15 points more Republican, a 79-point shift.
An additional way to look at these shifts is to consider the vote share and relative partisan lean of the 15 biggest localities in the state (by vote share) and the 15 smallest in each cycle in two comparative groups. Table 2 lays out these data for 1968 to 2016.
Table 2: Relative partisan lean and total vote share of the 15 largest and smallest localities in the state (by vote share)

Sources: Author’s calculations based on Virginia Department of Elections data
Interestingly, the 15 smallest localities in the state (again, based on today’s localities) were more Democratic-leaning than the 15 largest localities from 1976 to 1996, compared to the national popular vote. But starting in 2000, the 15 largest localities became more Democratic leaning, and the two groupings have only diverged further since then. Note that the smallest localities in the state of Virginia are not all deeply Republican today: the small city of Lexington is a fairly Democratic college town while Charles City County (confusing name, yes?) is plurality black and very Democratic — it was the only Virginia locality to back George McGovern in 1972. And not all of the 15 biggest localities at present are solidly Democratic. Trump carried Hanover County (14th-largest by vote share in 2016), a ruby-red GOP suburban/exurban county north of Richmond, by 32 points. But on the whole, the largest and smallest localities now reflect the urban-rural divide seen nationally in American politics: In 2016 Virginia’s 15 biggest places were, together, about 20 points more Democratic than the country as a whole, while the 15 smallest localities were about 15 points more Republican. And just as the country is becoming more urban, the share of the Old Dominion’s vote made up by the biggest places is increasing while that of the smallest areas is shrinking.
Conclusion
This article has presented voting data showing the significant shifts in Virginia’s voting behavior and its relative partisan lean over the 1968-2016 period. But it hasn’t exactly explained why this has happened. The answer to that question is partly reflective of the same forces that have changed politics throughout the country. For instance, as Northern Virginia grew rapidly, it attracted large numbers of highly-educated workers to serve in industries related to government, particularly federal contracting. College-educated voters have trended toward the Democratic Party overall, including white college grads. Based on the Census Bureau’s 2015 estimates, Virginia ranks sixth among the 50 states in its percentage of the population 25 years or older that has at least a bachelor’s degree.
Virginia has also become more diverse in many ways. It’s become more racially and ethnically varied since the 1970 census. Race and education are now the two strongest indicators of voting preference, so the fact that Virginia’s population has moved from being 19% nonwhite in 1970 to about 37% nonwhite today is surely a part of the story as well. The fastest-growing localities in the state, such as Loudoun and Prince William counties in Northern Virginia, have become dramatically more diverse since 1970. Loudoun was 13% nonwhite in 1970; today, it is 10 times bigger in overall population and is about 41% nonwhite. Prince William has seen even more dramatic changes: It was about 6% nonwhite in 1970; today, its population is roughly five times bigger (if you subtract Manassas and Manassas Park from its 1970 totals; they’re now independent cities) and the county is 54% nonwhite. The physical origins of Virginia’s population are now more diverse as well. In 1970, 63% of the state’s population had been born in the state; in 2010, that figure had fallen to just below 50%.
These are just some of the factors that have moved Virginia in the Democrats’ direction in national politics. It will be interesting to see where it goes next.